Balance of payments, 1:st quarter 2018: Corrected at 10.30
Reduced surplus in the current account
Statistical news from Statistics Sweden 2018-06-04 9.30
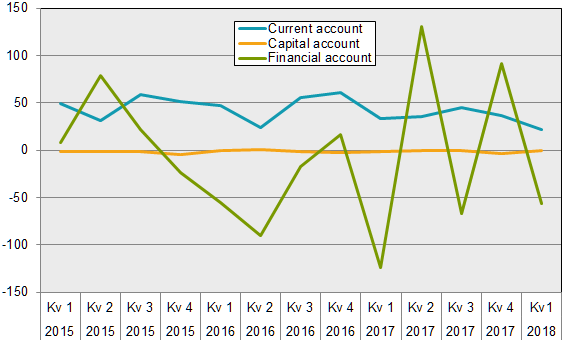
The current account showed a surplus of SEK 22 billion in the first quarter of 2018. The surplus in the corresponding quarter last year was SEK 34 billion. The weakened current account is chiefly explained by a lower surplus in trade in services. A reduced surplus in trade in goods and primary income and an increased deficit in secondary income also contributed to the weakened current account.
Trade in goods produced a surplus of SEK 25 billion, which is a decrease of more than SEK 2 billion compared with the corresponding quarter last year. Merchanting, which is included in trade in goods, resulted in a SEK 24 billion surplus, which was an increase of SEK 3 billion compared with the corresponding quarter last year.
Reduced surplus in trade in services
Trade in services produced a surplus of SEK 4 billion, which is a decrease of SEK 6 billion compared with the corresponding quarter last year. Telecommunications, computer and information services, transports and other business services were the main contributors on a net basis to the decreased surplus in trade in services, while charges for the use of intellectual property was the main contributor, with an increased surplus.
Exports of services were SEK 142 billion and decreased by SEK 2 billion, while imports of services amounted to SEK 139 billion, an increase of SEK 4 billion compared with the corresponding quarter last year. Among services, exports of other business services decreased the most, while imports of travel services increased compared with the corresponding quarter last year.
Reduced surplus in primary income
Primary income showed a surplus of SEK 20 billion in the quarter, a decrease of just over SEK 2 billion compared with the corresponding quarter last year. Compensation of employees gave a surplus of close to SEK 3 billion while investment income gave a surplus of SEK 17 billion, which was a reduction of just under SEK 1 billion.
Income from direct investments contributed a surplus of SEK 15 billion, which was an increase of SEK 1 billion compared with the corresponding quarter last year.
Income from portfolio investments contributed a surplus of SEK 1 billion during the quarter, which was a reduction of SEK 2 billion compared with the corresponding quarter last year. Interest payments to foreign investors decreased by SEK 3 billion, which led to a decreased deficit in the return on debt securities. Dividends on shares and fund holdings resulted in a net surplus of SEK 6 billion, which was a reduction compared with the corresponding quarter, when the surplus was SEK 10 billion.
Secondary income resulted in a deficit of SEK 26 billion and the deficit thereby increased by SEK 2 billion compared with the corresponding quarter last year. The capital account changed from a deficit of just under SEK 2 billion in the corresponding period last year to a balance.
Capital inflow in the financial account
The financial account produced a net capital inflow of SEK 56 billion in the first quarter of 2018. Portfolio investments and other investments resulted in capital inflows, while direct investments, financial derivatives and reserve assets resulted in capital outflows.
Portfolio investment transactions resulted in a net capital inflow of SEK 66 billion. Foreign investors increased their portfolio investments in Sweden by SEK 58 billion, while Swedish investors reduced their portfolio investments abroad by SEK 8 billion.
Swedish investors decreased their holdings in foreign debt securities by just under SEK 27 billion. Long-term debt securities decreased by SEK 23 billion and short-term debt securities decreased by just over SEK 3 billion. Holdings in foreign shares and funds increased by SEK 18 billion during the quarter.
Foreign investors’ holdings in Swedish debt securities increased by SEK 51 billion. The holdings of long-term debt securities increased by SEK 65 billion while short-term debt securities decreased by SEK 14 billion. Housing bonds issued in foreign currency contributed most to the rise with an increase of SEK 25 billion. The decrease in short-term debt securities is largely due to the maturity of treasury bills issued in SEK, which decreased by SEK 39 billion in total in the quarter.
Direct investments resulted in a capital outflow of SEK 58 billion. Swedish direct investments abroad increased by SEK 81 billion, while foreign direct investments in Sweden increased by SEK 23 billion.
Other investments resulted in a net capital inflow of SEK 55 billion. Other investments abroad increased by SEK 122 billion, while foreign other investments in Sweden increased by SEK 176 billion.
Financial derivatives produced a capital outflow of SEK 6 billion, while reserve assets gave a capital outflow of just under SEK 1 billion.
Increased net assets in the international investment position
At the end of the first quarter of 2018, Sweden’s international investment position showed net external assets of SEK 485 billion. This represents an increase compared to the previous quarter when net assets amounted to SEK 445 billion.
Assets increased by SEK 490 billion in the quarter while liabilities increased by SEK 450 billion. Direct investments contributed most to the increase in net assets through a combination of increased assets and reduced liabilities. Net assets in reserve assets grew somewhat while net debt increased in portfolio investments, and net assets decreased in other investments and derivatives.
Sweden’s largest net external assets are in other investments, direct investments and reserve assets. Sweden’s largest net liabilities are in debt securities in portfolio investments.
| 2018 | 2017 | 2017 | 2017 | 2016 | |
|---|---|---|---|---|---|
| Q1 | Q4 | Q1 | |||
| Current account | 21.9 | 37.0 | 33.6 | 151.6 | 187.0 |
| Trade in goods | 24.8 | 21.8 | 27.2 | 106.3 | 102.2 |
| Trade in services | 3.5 | 14.5 | 9.3 | 50.5 | 94.4 |
| Primary income | 19.5 | 20.0 | 21.1 | 65.6 | 49.9 |
| Secondary income | ‑25.8 | ‑19.3 | ‑23.9 | ‑70.8 | ‑59.5 |
| Capital account | ‑0.1 | ‑3.3 | ‑1.8 | ‑5.2 | ‑3.5 |
| Financial account | ‑56.3 | 91.9 | ‑124.1 | 32.0 | ‑146.0 |
| Directs investments | 57.9 | ‑20.4 | ‑6.1 | 37.0 | ‑53.5 |
| Portfolio investments | ‑65.9 | 74.8 | ‑125.4 | ‑58.2 | 50.2 |
| Financial derivatives | 5.8 | ‑10.7 | ‑18.1 | ‑68.9 | ‑22.8 |
| Other investments | ‑54.8 | 48.4 | 33.6 | 119.1 | ‑156.2 |
| Reserve assets | 0.6 | ‑0.1 | ‑8.2 | 3.0 | 36.4 |
Definitions and explanations
Revisions
The compilation of the balance of payments and the international investment position makes use of certain preliminary information. The statistics will be revised in line with more definitive figures in the updated statistics.
In connection with publication of the first quarter 2018, the time series for balance of payments and the international investment position was revised from the first quarter of 2017.
The table Revisions in balance of payments 2017Q1-2018Q1 contains the scope and description of revisions in balance of payments by account item.
The table Revisions in the international investment position 2017Q1-2018Q1 contains the scope and description of revisions in the international investment position by assets/liabilities and account item.
Next publishing will be
Balance of payments for the second quarter 2018 will be published 2018-09-04 at 09:30.
Statistical Database
More information is available in the Statistical Database
Feel free to use the facts from this statistical news but remember to state Source: Statistics Sweden.