Environmental accounts – Emissions to air 2015:
Emission reduction decreasing
Statistical news from Statistics Sweden 2017-03-29 9.30
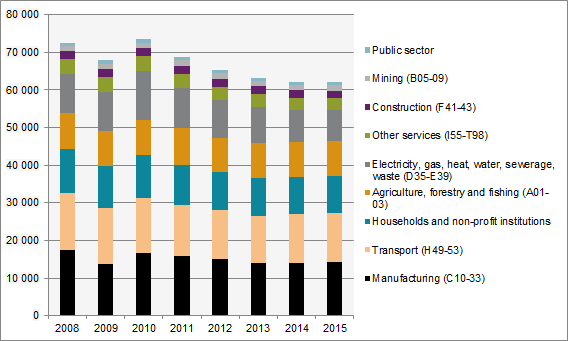
Emissions of greenhouse gases remained relatively unchanged in 2015 compared with 2014, according to new final statistics from Statistics Sweden’s Environmental Accounts. The downtrend in the electricity, gas and heat industry continued, while greenhouse gas emissions from manufacturing increased.
Statistics Sweden’s Environmental Accounts produces quarterly statistics on air emissions, preliminary yearly statistics and final yearly statistics on ‘production-based’ emissions. Read more about different ways to calculate emissions on the Swedish Environmental Protection Agency’s website:
* 2014 Gross regional product is preliminary
Greenhouse gas emissions from the electricity-, gas- and heating industry were at their lowest emission level in 2015 since the time series was started in 2008. Emissions from this sector amounted to 8.2 million tons in 2014, which is a decrease by almost 4 percent compared with 2014, and 19 percent compared with 2008. The reduction is in part due to increased use of biofuels, but also due to temporary disruptions at some facilities that used mainly fossil fuels in 2015. The available quarterly statistics for 2016 (first quarter to third quarter) suggest that the decline in 2015 was temporary.
On the other hand, greenhouse gas emissions from manufacturing industries have increased. Emissions from manufacturing industries have increased by almost 2 percent in 2015 compared with 2014. This ends the previous declining emission trend, which led to a 19 percent decrease of greenhouse emissions between 2008 and 2015. The main contributors to the increased emissions from the manufacturing industries stem from the production of basic metals and cement.
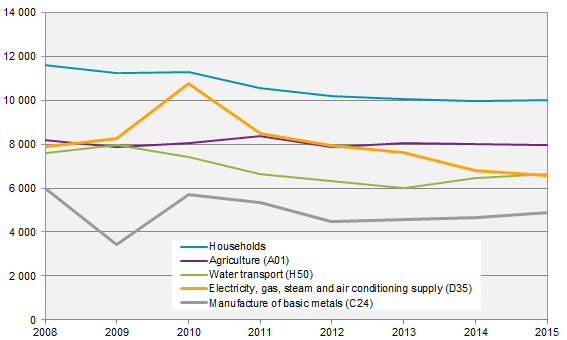
Emissions from households on top
When the emissions of greenhouse gases are distributed on a more detailed industry level than in the figure above, it shows that most of the emissions arise from households, agriculture, shipping, electricity-, gas- and heating plants as well as from the steel- and metal industry. These industries accounted for 58 percent of the emissions in 2015.
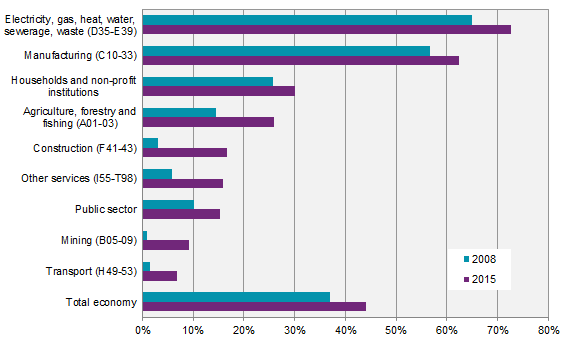
The use of biofuels continues to increase
The use of biomass as a source of fuel in Sweden has increased from 37 percent in 2008 to 44 percent in 2015. The total amount of fossil- and biofuels decreased slightly in the same period, while the amount of biofuels increased.
The increased use of biofuels can be seen in all industries. The proportion of biofuels, that is, the consumption of biofuels in relation to the total fuel consumption (fossil and biogenic) in each industry, is the highest for electricity-, gas- and district heating plants and for manufacturing industries. These industries also account for the largest use of biofuels in total.
Update of environmental economic profile in autumn 2017
Statistic Sweden’s Environmental Accounts also presents different industries’ emissions in relation to employment and value added (the industries’ contribution to the GDP). However, the statistics concerning yearly air emissions are ready before the yearly statistics on employment and value added. Therefore, an update about emission intensities and environmental economic profiles will be made in the autumn, when this data is available for 2015.
New analysis tool for environmental accounts data
There is a new tool available that combines data from the Environmental Accounts and economic data, in which emissions statistics can be further analysed. The tool is available on the Environmental Accounts’ webpage and can, for example, be used to compare industries and to study the relationship between the demand in the economy, energy use and emissions of different substances.
Definitions and explanations
The Environmental Accounts present national environmental statistics and economic statistics in the same framework using NACE industry classification. Environmentally-related statistics connected with the system of national accounts enable an analysis between the economy and the environment. The starting point is Swedish economic actors’ environmental impact, regardless of where in the world the emissions occur. Emissions from international bunkers, that is, international aviation and navigation arriving and refuelling at Swedish airports and harbours, are included as an approximation of Swedish companies’ emissions from international aviation and shipping. Emissions and removals from land use, and land use change (LULUCF), as well as carbon capture and storage (CCS) are not included.
These statistics on air emissions are based on a production perspective. Emissions are reported for the industry where emissions occur. Indirect emissions from imports and other consumption of goods and services are not included.
Since the last publication, there have been a number of revisions for 2008-2014 due to updated statistics and some minor development in the methodology. More information (in Swedish) on this is found under Documentation at:
System of Environmental and Economic Accounts
Next publishing will be
The next statistical news on quarterly emissions to air up to the fourth quarter of 2016 is scheduled for 2016-05-04 at 09:30. Preliminary annual statistics for 2016 are also published at the same time.
The next statistical news on annual emissions to air 2008-2016 (final statistics) is scheduled for spring 2018.
Statistical Database
More information is available in the Statistical Database
Feel free to use the facts from this statistical news but remember to state Source: Statistics Sweden.