Environmental accounts – Emissions to air Q1 2017:
Mild winter contributed to reduced greenhouse gas emissions
Statistical news from Statistics Sweden 2017-08-30 9.30
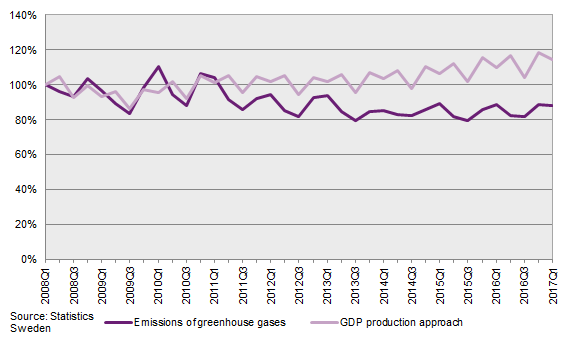
Emissions of greenhouse gases from the Swedish economy and households decreased in the first quarter of 2017, while the Swedish economy continued to grow. This decrease is mainly the result of a mild winter that led to reduced emissions from electricity, gas and heating. Emissions from households’ passenger cars continued to decrease. Meanwhile, emissions from the transport industry and manufacturing industries increased.
The Environmental Accounts at Statistics Sweden presents quarterly production-based emissions, that is, emissions to air from the Swedish economy..
In the first quarter of 2017, greenhouse gas emissions from the Swedish economy and households amounted to 16.3 million tonnes of carbon dioxide equivalents. This is a decrease of 0.5 percent compared with the same quarter in 2016. In the same period, GDP growth was 3.9 percent.
For territorial greenhouse gas emissions, used for monitoring national climate objectives, total emissions in the first quarter of 2017 amounted to 13.7 million tonnes of carbon dioxide equivalents, a decrease of 2.4 percent compared with same quarter of 2016. See also Swedish EPA website.
More information (in Swedish) about different ways to calculate emissions:
There are several driving forces behind the decreased emissions in the first quarter of 2017. The most important reason is that emissions levels for electricity, gas, heating, water and waste (NACE 35-39) decreased by 11.6 percent. The reduction is due to reduced use of fossil fuels. One reason for this is a mild winter. Emissions from households, mainly from passenger cars, also decreased, by 3.8 percent in the first quarter of 2017 compared with the same quarter in 2016.
The continued decrease in emissions from households is due to a change in the use of different fuel types. The use of gasoline, still an important fuel, and ethanol decreased, while the use of fossil and biogenic diesel increased. However, the proportion of biodiesel blended into fossil diesel is somewhat lower than in the first quarter of 2016.
Emissions from the transport industry (NACE 49-53) increased by 9 percent and increased in shipping and aviation as well as land transport. Most emissions and a majority of the increase in emissions are related to international shipping. Emissions from manufacturing industries increased by 2.4 percent due to increased production.
There was economic growth in the first quarter of 2017 in most industries, many of which have low levels of greenhouse gas emissions. Industries in which value added increased most include various services, as well as construction (NACE 41-43), manufacture of motor vehicles (NACE 29), refineries (NACE 19) and the public sector. The largest decrease in value added appeared in electricity, gas and heat production and water and waste (NACE 35-39).
Revisions
Since the previous publication on 2017-05-05, the following revisions have been made for quarters from 2008Q1 to 2016Q4:
- The method for calibrating stationary combustion within industry and electricity and heat production was updated, 2008Q1–2016Q4.
- The distribution model for stationary combustion within the services and the public sector was updated, 2008Q1–2016Q4.
- The distribution model based on latest annual statistics on air emission accounts for some emissions not related to energy was updated, 2008Q1–2016Q4.
- Minor updates were made in quarterly fuel statistics and monthly fuel, gas and inventory statistics in 2016, and minor updates were made in the Industrial production index (IPI).
- A correction was made for stationary combustion in agriculture and forestry in 2008.
- In some industries, most notably manufacture of textile, manufacture of electrical equipment, other manufacture of machinery and equipment, manufacture of other transport equipment, manufacture of furniture etc. and residential care activities, the reallocations resulted in significant changes in emission estimates. However, at national level, emissions are more or less the same in all quarters.
More information (in Swedish) on the revisions is available at the Environmental Accounts’ product page under Documentation.
Developments in different industries
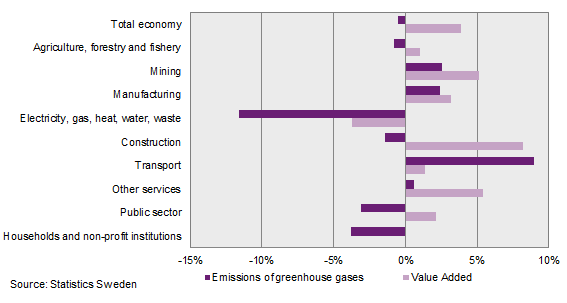
The connection between emissions of greenhouse gases and industry’s contribution to the Swedish economy varies between industries, due to the different types of activities in each industry. Some industries are emissions-intensive, and increased production means higher emissions, while other industries may increase value added without any significant increase in emissions levels.
| Sector | Emissions of greenhouse gases | Value added | |||||
|---|---|---|---|---|---|---|---|
| 2017Q1 | Change compared to same quarter 2016 | 2017Q1 | Change compared to same quarter 2016 | ||||
| Agriculture, forestry and fishing | 2 213 | ‑17 | ‑0.8% | 13 295 | 133 | 1.0% | |
| Mining | 356 | 9 | 2.6% | 5 770 | 282 | 5.1% | |
| Manufacturing | 3 778 | 90 | 2.4% | 164 053 | 5 109 | 3.2% | |
| Electricity, gas, heat, water, waste | 2 790 | ‑366 | ‑11.6% | 33 740 | ‑1 294 | ‑3.7% | |
| Construction | 425 | ‑6 | ‑1.4% | 57 376 | 4 350 | 8.2% | |
| Transport | 3 569 | 294 | 9.0% | 37 869 | 516 | 1.4% | |
| Other services | 796 | 5 | 0.6% | 446 051 | 22 995 | 5.4% | |
| Public sector | 169 | ‑5 | ‑3.1% | 212 077 | 4 479 | 2.2% | |
| Households and non-profit institutions [1] | 2 175 | ‑86 | ‑3.8% | 12 342 | 187 | 1.5% | |
| Total economy | 16 271[2] | ‑84 | ‑0.5% | 982 573 | 36 757 | 3.9% | |
[1] Only non-profit institutions provide value added. [2] For territorial greenhouse gas emissions, used for monitoring national climate objectives, total emissions in the first quarter of 2017 amounted to 13.7 million tonnes of carbon dioxide equivalents, a decrease of 2.4 percent compared with same quarter of 2016. See also the Swedish EPA website.
Agriculture, forestry and fishing: Agriculture, forestry and fishing accounted for 14 percent of total greenhouse gas emissions. Most greenhouse gases emitted in this sector (around 90 percent) come from agriculture. Emissions of greenhouse gases decreased by 0.8 percent in the first quarter compared with the same quarter of 2016. Forestry accounts for more than 70 percent of value added in this sector. Value added in the whole sector increased by 1.0 percent in the first quarter of 2017 compared with the same quarter of 2016.
Mining: Emissions from mining account for 2 percent of all emissions in the Swedish economy and households. Emissions increased by 2.6 percent in the first quarter compared with the same quarter of 2016. Value added increased by 5.1 percent in the first quarter of 2017compared with the same quarter of 2016.
Manufacturing: Manufacturing accounts for 23 percent of total greenhouse gas emissions in the Swedish economy and households. Greenhouse gas emissions increased by 2.4 percent in the first quarter of 2017compared with the same quarter of 2016. In the period, value added decreased by 3.2 percent. Industries that contribute the most to greenhouse gas emissions are steel, metal, chemicals production, refineries and cement production. The most significant increase in emissions was in the cement industry.
Electricity, gas, heat, water and waste: Greenhouse gas emissions in this sector annually account for 17 percent of total emissions of greenhouse gases from the Swedish economy and households. Most emissions of greenhouse gases (65 to 85 percent each quarter) come from electricity and heat production. Emissions levels in the first quarter of 2017 were 11.6 percent lower than in the same quarter of 2016. Use of biofuels in the sector is at about the same level as in the same quarter in 2016, but the need to add fossil fuels for heating was significantly lower, as the winter of 2017 was mild compared to the winter of 2016. In the period, value added decreased by 3.7 percent.
Construction: Model-estimated greenhouse gas emissions in this sector account for 3 percent of total greenhouse gas emissions in the Swedish economy and households. Emissions arise mainly from transport, machinery and industrial vehicles. In the first quarter of 2017, emissions decreased by 1.4 percent, while value added increased by 8.2 percent compared with the same period in 2016.
Transport: Greenhouse gas emissions in the transport industry account for 22 percent of total emissions in the Swedish economy and households. Emissions increased by 9.0 percent in the first quarter in 2017 compared with the same quarter in 2016. Emissions come mainly from maritime traffic, but the increase in the first quarter is from both maritime traffic, aviation and land transport. Value added increased by 1.4 percent in the first quarter of 2017compared with the same quarter of 2016.
Other services: Greenhouse gas emissions in other services account for 5 percent of total emissions in the Swedish economy and households. Emissions in these industries are relatively small compared to value added and are mainly due to road transports. In the first quarter of 2017, emissions increased by 0.6 percent, while value added increased by 5.4 percent compared with the same quarter in 2016.
Public sector: Greenhouse gas emissions in the public sector (central government, county and municipality) account for about 1 percent of total emissions in the Swedish economy and households. Emissions arise mainly from working machinery, road transports and military activities. Emissions decreased by 3.1 percent in the first quarter of 2017 compared with the same quarter in 2016. Value added increased by 2.2 percent in the same period.
Households and non-profit institutions: Greenhouse gas emissions from households and non-profit institutions account for 13 percent of total emissions in the Swedish economy and households. Emissions arise mainly from households’ passenger car transport. Changes in fuels used is an important driving force for emissions: Use of gasoline, still an important fuel, and ethanol is decreasing. At the same time, use of fossil diesel and biodiesel are increasing in this sector. Taken together, this results in decreased emissions by 3.8 percent in the first quarter of 2017compared with the same quarter in 2016. Only non-profit institutions contribute with a small level of value added.
Definitions and explanations
The Environmental Accounts are compiled within the framework of the System of Environmental and Economic Accounts (SEEA) and present national environmental statistics and economic statistics in the same framework, using NACE industry classification. Environmentally-related statistics connected to the system of national accounts enable an analysis between the Swedish economy and the impact that each industry has on the environment. Emissions from international bunkers, that is, international aviation and navigation arriving and refuelling at Swedish airports and harbours, are included. Emissions and removals from land use and land use change (LULUCF) and carbon capture and storage (CCS) are not included.
Annual Environmental Accounts on emissions to air by industry currently has a production time of 15 months. There is a demand for more up-to-date statistics on emissions to air of greenhouse gases. To meet this need, Environmental Accounts at Statistics Sweden has developed quarterly statistics on emissions to air by industry that was also used to produce preliminary annual statistics.
Quarterly statistics on all greenhouse gases and a number of air pollutants are available in Sweden’s Statistical Database. Excel spread sheets are also available for download on Statistics Sweden’s website, and include data and figures on greenhouse gas emissions and emissions intensities by value added and by employees.
The statistics on air emissions are based on a production perspective. Emissions are reported for the industry where emissions occur. Indirect emissions from imports and other consumption of goods and services are not included.
Statistics on emissions to air provided by the Swedish Environmental Protection Agency (EPA) follow the UNFCCC framework, covering emissions within Sweden’s territory. Sectors are listed by emissions category, not by industry. Emissions and removals from land use and land use change are included, while emissions from international aviation and navigation are reported separately.
The Swedish Environmental Protection Agency’s statistics on emissions to air
More information (in Swedish) on different ways to calculate emissions:
Next publishing will be
The next statistical news on quarterly emissions to air up to and including the fourth quarter of 2016 is scheduled for publication on 2017-10-26 at 09:30.
The next statistical news on regional emissions to air up to and including 2015 is scheduled for publication on 2017-11-09 at 09:30.
The next statistical news on annual emissions to air 2008–2016 (final statistics) is scheduled for publication in spring 2018.
Statistical Database
More information is available in the Statistical Database
Feel free to use the facts from this statistical news but remember to state Source: Statistics Sweden.