Exports and imports of goods, Q4 2025/January-December 2025, in current prices and in constant prices
Lower prices lead to a decrease in terms of value despite increased volumes
Statistical news from Statistics Sweden 2026-02-27 8.00
In the fourth quarter of 2025, exports of goods decreased by 2 percent in value, while they increased by 4 percent in volume compared with the same period a year ago. At the same time, imports of goods fell by 3 percent in value, while they rose by 2 percent in volume.
- In 2025, exports to the Unites States decreased by 9 percent, which amounted to about SEK 17 billion. Exports of passenger cars and pharmaceutical products accounted for the largest decrease, says Ari Mansikkaviita, statistician at Statistics Sweden.
Summary
- In the fourth quarter of 2025, Swedish exports of goods decreased by 2 percent in value (in current prices), while they rose by 4 percent in terms of volume (in constant prices), compared with the same period a year ago. At the same time, imports of goods decreased by 3 percent in value, while they increased by 2 percent in terms of volume.
- Compared with the previous quarter, Swedish exports of goods increased by 10 percent in both value and volume. Imports of goods rose by 7 percent in both value and volume.
- In the period January–December 2025, the value of Swedish exports of goods decreased by 1 percent and amounted to SEK 2 044 billion, compared with the same period a year ago. At the same time, the value of imports of goods decreased by 1 percent and amounted to SEK 1 979 billion.
- In the period January–December 2025, exports of goods increased by 4 percent in volume and imports of goods rose by 2 percent.
- Net trade shows a surplus of SEK 65 billion in the period January–December 2025. In the same period in 2024, there was a net trade surplus of SEK 64 billion.
Detailed information about the fourth quarter 2025 (in current prices and in constant prices)
Exports of pharmaceutical products rose by 10 percent in value and by 30 percent in volume
Exports of machinery/transport equipment remained the same in value in the fourth quarter, while they increased by 6 percent in volume, compared with the same period a year ago. Exports of wood and paper products fell by 8 percent in value, and by 2 percent in volume. Exports of minerals decreased by 5 percent in value, and by 4 percent in volume. Within this product area, exports of iron ore and concentrates fell by 20 percent in value and by 8 percent in volume. Exports of chemicals/rubber products rose by 2 percent in value, and by 16 percent in volume. Within this product area, exports of pharmaceutical products increased by 10 percent in value and by 30 percent in volume. Exports of mineral fuels/electric current decreased by 24 percent in value, and by 14 percent in volume. Within the other products area, exports of food/beverages/tobacco increased by 4 percent in value, and by 5 percent in volume.
Swedish exports of goods by important SITC commodity groups
| Exports | |||||||
|---|---|---|---|---|---|---|---|
| Value (current prices, SEK million) | Value (current prices) | Volume (value in constant prices) | Value (current prices) | Volume (value in constant prices) | |||
| Commodity group according to SITC | Share in % | Change in % | Change in % | Change in % | Change in % | ||
| January-December 2025 | January-December 2024 | January-December 2025 | Q1-4 2025/Q1-4 2024 | Q1-4 2025/Q1-4 2024 | Q4 2025/Q4 2024 | Q4 2025/Q4 2024 | |
| Total | 2 044 285 | 2 067 525 | 100,0 | -1 | 4 | -2 | 4 |
| Wood and paper products | 181 350 | 185 901 | 8,9 | -2 | -3 | -8 | -2 |
| Wood | 47 497 | 44 413 | 2,3 | 7 | -2 | -2 | -6 |
| Pulp and waste paper | 29 200 | 29 665 | 1,4 | -2 | 8 | 5 | 30 |
| Paper, paper products | 96 698 | 103 986 | 4,7 | -7 | -6 | -15 | -10 |
| Minerals | 215 961 | 213 478 | 10,6 | 1 | 5 | -5 | -4 |
| Iron ore and concentrates | 26 974 | 27 575 | 1,3 | -2 | 13 | -20 | -8 |
| Iron and steel | 73 231 | 78 684 | 3,6 | -7 | 1 | -12 | -4 |
| Non-ferrous metals | 66 501 | 61 247 | 3,3 | 9 | 8 | -3 | -6 |
| Chemicals, rubber products | 315 148 | 312 410 | 15,4 | 1 | 8 | 2 | 16 |
| Organic/inorganic chemicals | 28 816 | 28 967 | 1,4 | -1 | 8 | 2 | 12 |
| Pharmaceutical products | 152 724 | 151 035 | 7,5 | 1 | 9 | 10 | 30 |
| Plastics | 51 934 | 51 211 | 2,5 | 1 | 9 | -10 | 4 |
| Mineral fuels, electric current | 134 920 | 158 182 | 6,6 | -15 | -1 | -24 | -14 |
| Petroleum products | 108 021 | 132 378 | 5,3 | -18 | -4 | -29 | -16 |
| Machinery, transport equipment | 898 602 | 918 446 | 44,0 | -2 | 3 | 0 | 6 |
| Manufactures of metals | 50 365 | 50 574 | 2,5 | 0 | 2 | -2 | 1 |
| Industrial machinery | 298 328 | 295 557 | 14,6 | 1 | 4 | 5 | 9 |
| Electronics, telecommunication | 218 759 | 216 173 | 10,7 | 1 | 12 | -1 | 8 |
| Road vehicles | 261 633 | 291 952 | 12,8 | -10 | -8 | -2 | 2 |
| Passenger cars | 133 204 | 159 686 | 6,5 | -17 | -12 | -9 | -1 |
| Lorries, trucks[1] | 44 662 | 45 813 | 2,2 | -3 | 2 | 4 | 6 |
| Parts, accessories | 66 037 | 68 321 | 3,2 | -3 | -4 | 1 | 1 |
| Other transport equipment | 19 501 | 14 928 | 1,0 | 31 | 37 | 40 | 30 |
| Instruments, photo/optical products | 50 016 | 49 261 | 2,4 | 2 | 7 | -7 | -1 |
| Other products | 298 304 | 279 108 | 14,6 | 7 | 9 | 3 | 5 |
| Food, beverages, tobacco | 149 298 | 140 122 | 7,3 | 7 | 9 | 4 | 5 |
| Textiles, clothing, footwear | 56 621 | 53 361 | 2,8 | 6 | 11 | 5 | 11 |
| Furniture | 22 294 | 22 632 | 1,1 | -1 | -4 | -3 | -4 |
Imports of crude petroleum oils fell by 43 percent in value and by 24 percent in volume
Imports of machinery/transport equipment increased by 2 percent in value and by 6 percent in volume in the fourth quarter, compared with the same period a year ago. Within this product area imports of passenger cars fell by 11 percent in value, and by 7 percent in volume. Imports of wood and paper products decreased by 10 percent in value and by 5 percent in volume. Imports of minerals decreased by 5 percent in value, and by 1 percent in volume. Imports of chemicals/rubber products decreased by 1 percent in value, while they increased by 3 percent in volume. Imports of mineral fuels/electric current fell by 31 percent in value and by 15 percent in volume. Within this product area, imports of crude petroleum oils decreased by 43 percent in value, and by 24 percent in volume. Within the other products area, imports of food/beverages/tobacco increased by 4 percent in value, and by 6 percent in volume.
Swedish imports of goods by important SITC commodity groups
| Imports | |||||||
|---|---|---|---|---|---|---|---|
| Value (current prices, SEK million) | Value (current prices) | Volume (value in constant prices) | Value (current prices) | Volume (value in constant prices) | |||
| Commodity group according to SITC | Share in % | Change in % | Change in % | Change in % | Change in % | ||
| January-December 2025 | January-December 2024 | January-December 2025 | Q1-4 2025/Q1-4 2024 | Q1-4 2025/Q1-4 2024 | Q4 2025/Q4 2024 | Q4 2025/Q4 2024 | |
| Total | 1 979 335 | 2 003 809 | 100,0 | -1 | 2 | -3 | 2 |
| Wood and paper products | 53 748 | 55 036 | 2,7 | -2 | -2 | -10 | -5 |
| Minerals | 154 175 | 159 124 | 7,8 | -3 | 1 | -5 | -1 |
| Iron and steel | 51 747 | 56 431 | 2,6 | -8 | 1 | -10 | 0 |
| Non-ferrous metals | 40 446 | 43 191 | 2,0 | -6 | -5 | -5 | -1 |
| Metalliferous ores, metal scrap | 33 418 | 31 542 | 1,7 | 6 | 6 | 0 | -3 |
| Chemicals, rubber products | 262 498 | 266 883 | 13,3 | -2 | 1 | -1 | 3 |
| Organic/inorganic chemicals | 51 618 | 58 035 | 2,6 | -11 | -5 | -10 | -2 |
| Pharmaceutical products | 85 019 | 80 931 | 4,3 | 5 | 4 | 8 | 8 |
| Plastics | 40 564 | 42 935 | 2,0 | -6 | -1 | -12 | -6 |
| Crude rubber, rubber products | 20 769 | 20 969 | 1,0 | -1 | -3 | 1 | 3 |
| Mineral fuels, electric current | 164 025 | 209 959 | 8,3 | -22 | -4 | -31 | -15 |
| Crude petroleum oils | 88 612 | 121 295 | 4,5 | -27 | -8 | -43 | -24 |
| Petroleum products | 57 619 | 66 802 | 2,9 | -14 | 2 | -12 | 0 |
| Machinery, transport equipment | 888 717 | 879 001 | 44,9 | 1 | 3 | 2 | 6 |
| Manufactures of metals | 61 818 | 60 341 | 3,1 | 2 | 4 | 1 | 5 |
| Industrial machinery | 203 365 | 210 452 | 10,3 | -3 | -2 | -2 | 0 |
| Electronics, telecommunication | 326 811 | 326 487 | 16,5 | 0 | 5 | 5 | 11 |
| Road vehicles | 215 886 | 213 861 | 10,9 | 1 | 1 | -6 | -2 |
| Passenger cars | 107 499 | 108 197 | 5,4 | -1 | 1 | -11 | -7 |
| Parts and accessories | 66 814 | 68 778 | 3,4 | -3 | -6 | -4 | -2 |
| Other transport equipment | 28 337 | 16 484 | 1,4 | 72 | 71 | 123 | 132 |
| Instruments, photo/optical equip | 52 500 | 51 376 | 2,7 | 2 | 3 | 2 | 6 |
| Other products | 456 172 | 433 807 | 23,0 | 5 | 6 | 1 | 4 |
| Food, beverages, tobacco | 243 177 | 228 555 | 12,3 | 6 | 7 | 4 | 6 |
| Textiles, clothing, footwear | 95 326 | 94 560 | 4,8 | 1 | -1 | -6 | -6 |
| Furniture | 26 763 | 26 623 | 1,4 | 1 | 5 | -3 | 5 |
Value and volume trends
The value index and the volume index describe nominal and real value trends over time. The real value trends describe trends in which price changes have been removed. The indices are chain indices with base year 2015=100.
Value and volume trends for exports of goods
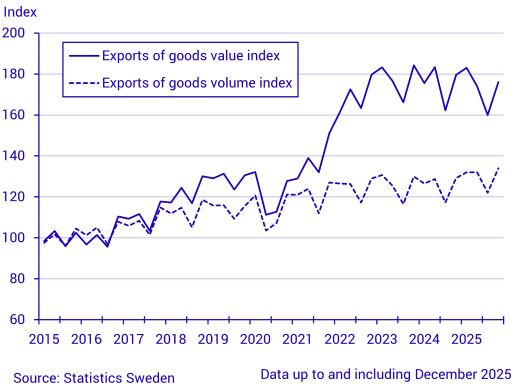
The value index and the volume index for exports of goods increased in the fourth quarter compared with the third quarter. The value index is lower compared with the same period last year, while the volume index is higher.
Value and volume trends for imports of goods
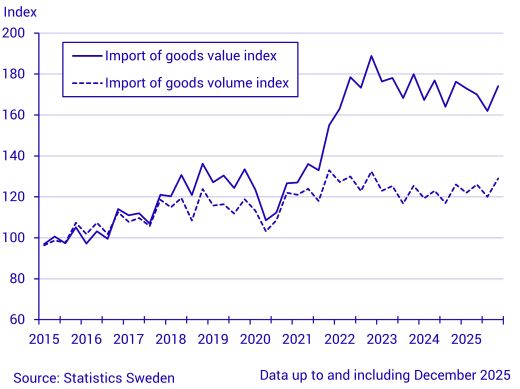
The value index and the volume index for imports of goods increased in the fourth quarter compared with the third quarter. The value index is lower compared with the same period last year, while the volume index is higher.
Detailed information about January–December 2025 (in current prices and in constant prices)
Exports of passenger cars fell by 17 percent in value and by 12 percent in volume
In the period January-December 2025, exports of machinery/transport equipment decreased by 2 percent in value, while they increased by 3 percent in volume, compared with the same period a year ago. Within this product area, exports of passenger cars fell by 17 percent in value, and by 12 percent in volume. Exports of wood and paper products decreased by 2 percent in value, and by 3 percent in volume. Exports of minerals rose by 1 percent in value, and by 5 percent in volume. Within this product area, exports of iron ore and concentrates fell by 2 percent in value, while they rose by 13 percent in volume. Exports of chemicals/rubber products increased by 1 percent in value, and by 8 percent in volume. Exports of mineral fuels/electric current fell by 15 percent in value, and by 1 percent in volume. Within the other products area, exports of food/beverages/tobacco increased by 7 percent in value, and by 9 percent in volume.
Imports of food/beverages/tobacco rose by 6 percent in value and by 7 percent in volume
In the period January-December 2025, imports of machinery/transport equipment increased by 1 percent in value, and by 3 percent in volume, compared with the same period a year ago. Imports of wood and paper products fell by 2 percent in both value and volume. Imports of minerals decreased by 3 percent in value, while they increased by 1 percent in volume. Imports of chemicals/rubber products fell by 2 percent in value, while they rose by 1 percent in volume. Imports of mineral fuels/electric current fell by 22 percent in value, and by 4 percent in volume. Within this product area, imports of crude petroleum oils decreased by 27 percent in value and by 8 percent in volume. Within the other products area, imports of food/beverages/tobacco rose by 6 percent in value and by 7 percent in volume.
Detailed information about January–December 2025 (current prices)
Imports of goods from the United Kingdom fell by 13 percent
In the period January-December 2025, Sweden’s exports of goods to EU27 decreased by 1 percent, while imports from there remained the same, compared with the same period a year ago. Exports to euro countries fell by 3 percent, and imports from there by 1 percent. Among the EU countries, exports to Germany fell by 3 percent and to Finland by 4 percent, while exports to Denmark rose by 2 percent. Imports from Germany decreased by 2 percent, while imports from Finland increased by 2 percent, and from Denmark by 1 percent.
Exports to other European countries increased by 3 percent, while imports from there decreased by 8 percent. Exports to the United Kingdom fell by 1 percent, and imports from there by 13 percent. Exports to Norway increased by 1 percent, while imports from there decreased by 9 percent. Exports to Russia rose by 53 percent, while imports from there fell by 94 percent. In the period, exports of chemicals/rubber products accounted for the increase to Russia.
Exports to Asia fell by 4 percent, and imports from there by 1 percent. Exports to China decreased by 14 percent, while imports from there remained the same.
Exports to the United States fell by 9 percent, while imports from there rose by 20 percent. In the period, imports of other transport equipment accounted for the increase from the United States.
Swedish exports and imports of goods by regions
| Exports | Imports | |||||||
|---|---|---|---|---|---|---|---|---|
| Value | Value | |||||||
| Region | January-December | Share in % | Change in % | January-December | Share in % | Change in % | ||
| 2025 | 2024 | 2025 | 2025/2024 | 2025 | 2024 | 2024 | 2025/2024 | |
| Total | 2 044 285 | 2 067 525 | 100,0 | -1 | 1 979 335 | 2 003 809 | 100,0 | -1 |
| Europe | 1 498 737 | 1 499 627 | 73,3 | 0 | 1 629 135 | 1 655 321 | 82,3 | -2 |
| EU27_2020 | 1 103 599 | 1 116 952 | 54,0 | -1 | 1 336 254 | 1 338 625 | 67,5 | 0 |
| EMU-20 | 828 753 | 852 537 | 40,5 | -3 | 1 036 618 | 1 046 139 | 52,4 | -1 |
| Other European countries | 395 138 | 382 675 | 19,3 | 3 | 292 882 | 316 696 | 14,8 | -8 |
| Africa | 41 885 | 42 191 | 2,0 | -1 | 12 870 | 22 772 | 0,7 | -43 |
| North Africa | 21 971 | 22 515 | 1,1 | -2 | 5 480 | 9 117 | 0,3 | -40 |
| West Africa | 5 824 | 3 658 | 0,3 | 59 | 3 658 | 10 917 | 0,2 | -66 |
| Central, East and Southern Africa | 14 091 | 16 019 | 0,7 | -12 | 3 732 | 2 738 | 0,2 | 36 |
| America | 250 293 | 260 820 | 12,2 | -4 | 123 399 | 108 556 | 6,2 | 14 |
| North America | 205 958 | 216 412 | 10,1 | -5 | 91 145 | 77 451 | 4,6 | 18 |
| Central and South America | 44 334 | 44 408 | 2,2 | 0 | 32 253 | 31 104 | 1,6 | 4 |
| Asia | 226 096 | 235 580 | 11,1 | -4 | 210 140 | 211 327 | 10,6 | -1 |
| Middle- and Near East | 43 666 | 43 816 | 2,1 | 0 | 6 937 | 12 848 | 0,4 | -46 |
| Other countries in Asia | 182 430 | 191 763 | 8,9 | -5 | 203 203 | 198 479 | 10,3 | 2 |
| Oceania and Antarctica | 20 102 | 22 066 | 1,0 | -9 | 3 789 | 5 832 | 0,2 | -35 |