Research and Development in Sweden 2020
Expenditure on research and development increased in 2020
Statistical news from Statistics Sweden 2021-10-28 9.30
In 2020, expenditure on research and development (R&D) in Sweden increased. The business sector is the main driver of this progression. The number of full-time equivalents (FTEs) also increased, although some decreases were visible in terms of the share of FTEs performed by external staff.
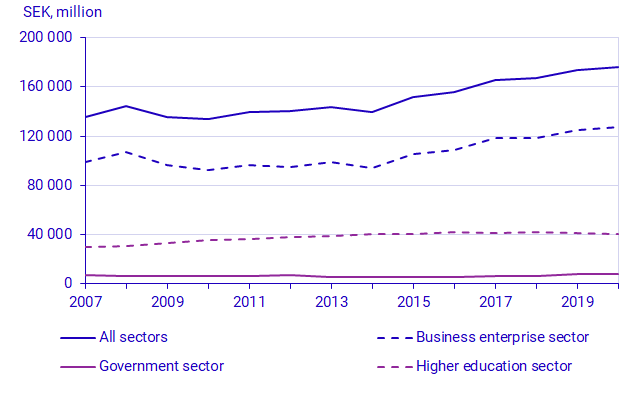
Total expenditure on intramural R&D amounted to SEK 175.8 billion in 2020, an increase of SEK 2.2 billion from 2019, corresponding to 1.2 percent in fixed prices. R&D intensity expressed as a percentage of GDP was 3.5 percent in 2020, up by 0.1 percentage points compared with 2019. Two factors that together contributed to the increase in R&D intensity were the continued rise in total expenditure on intramural R&D and the progression of GDP, which decreased by 2.8 percent in 2020 compared with the previous year.

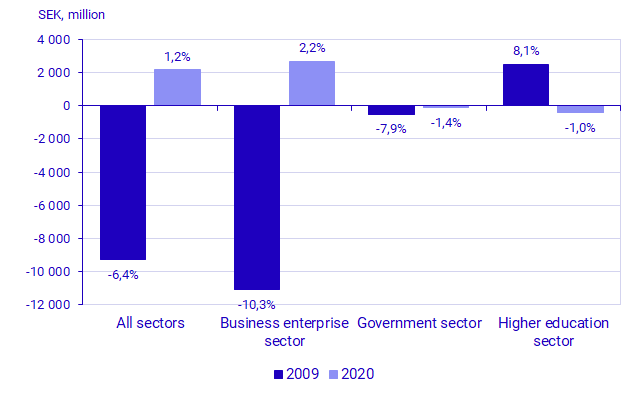
The increase in intramural R&D expenditure is driven by the business sector, which accounts for the majority of Sweden’s R&D expenditure. Expenditure increased by 2.2 percent compared with 2019. On the other hand, R&D expenditure in the government sector and in the higher education sector decreased by 1.4 percent and 1.0 percent, respectively. In the private non-profit sector, intramural R&D expenditure is estimated to have increased by 1.5 percent in 2020. However, this expenditure only accounts for 0.1 percent of the total.
The fact that total intramural R&D expenditure increased, despite the COVID-19 pandemic, is a reversal of the trend. After the 2008 financial crisis, total expenditure decreased by 6.4 percent in fixed prices. In the business sector, the decline was 10.3 percent from 2008 to 2009. In 2020, the opposite occurred - expenditure increased both in total and within the business sector. At the aggregated level, a similar progression is also visible at the international level. The OECD notes that the COVID-19 pandemic may constitute the first global economic crisis during which R&D expenditure did not decrease. Read more at: Main Science and Technology Indicators - OECD

Number of FTEs in R&D activities increased in 2020, while the share performed by external staff decreased
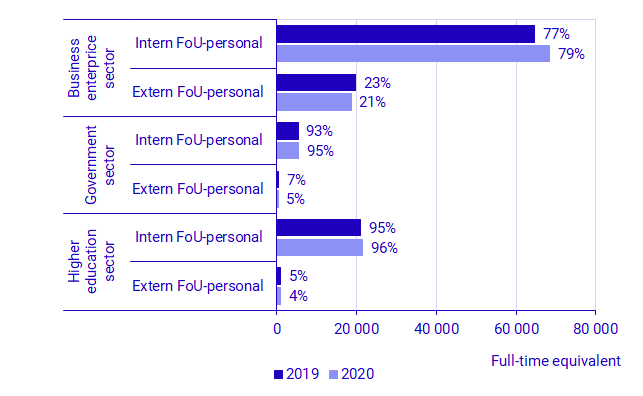
About 121 100 FTEs were performed in R&D activities in Sweden in 2020, which is an increase of about 3 100 FTEs, equivalent to 2.6 percent, compared with 2019. Unlike R&D expenditure, FTEs increased in all sectors - except the private non-profit sector - by between 1.3 percent in the government sector and 2.9 percent in the business sector. In 2020, the private non-profit sector accounted for less than 1 percent of the total number of FTEs in R&D in Sweden, which is unchanged compared with 2019.
There are clear differences in development in terms of the number of FTEs performed by internal staff compared with external staff. The number of FTEs performed by external staff, such as consultants, decreased by 6.3 percent in total between 2019 and 2020. In the government sector, the corresponding decrease was 20.0 percent. It is possible that the COVID-19 pandemic may have had an effect on the extent to which consults were engaged to carry out work within R&D activities in 2020.

Definitions and explanations
Research and Development (R&D)
Research and experimental development (R&D) comprise creative and systematic work undertaken in order to increase the stock of knowledge and to devise new applications of available knowledge in all fields of science.
To be defined as an R&D activity, an activity must be:
Novel: An R&D activity undertaken in order to generate new knowledge and to devise new applications of available knowledge.
Creative: R&D activities based on original concepts or hypotheses.
Uncertain: The final outcome of R&D activities is generally uncertain. There is also uncertainty related to the cost or time needed to achieve the expected results.
Systematic: R&D activities are performed systematically and are planned and budgeted.
Transferable and/or reproducible: An R&D activity should lead to results that could be possibly transferable and/or reproducible.
Intramural R&D
Activities carried out in Sweden by the organisation’s own personnel or by consultants in an R&D project led by the organisation, in the organisation’s own R&D activities. Intramural R&D also includes R&D carried out on commission.
FTE on R&D
One full-time equivalent is defined as the number of hours conventionally worked by a full-time employee over one year. Thus, a full-time employee spending half their working hours on R&D spends 0.5 FTEs on R&D. One person can never perform more than one FTE, even if the person works overtime.
Information on external FTEs in intramural R&D activities is collected and published as from the reference year 2019. The statistics should be treated with caution.
Fixed price calculation
This item of news contains comparisons over time concerning intramural R&D expenditure. Thus, the figures are presented at the 2020 price level to remove any price effects. For fixed price calculation, a GDP deflator is used. GDP at market price in nominal and fixed prices is used and published here:
Next publishing will be
Statistics on research and development in 2021 will be published in October 2022.
Statistical Database
More information is available in the Statistical Database
Feel free to use the facts from this statistical news but remember to state Source: Statistics Sweden.
