Localities 2015:
8.6 million live in Sweden's localities
Statistical news from Statistics Sweden 2016-10-25 9.30
Sweden now has nine localities with more than 100 000 inhabitants; Helsingborg is the most recent city to surpass this size class. In 2015 there were 1 979 urban areas in Sweden. This is 23 more than in 2010. Those localities that are included in the statistics are briefly defined as continuous buildings with a maximum of 200 metres between the houses and at least 200 inhabitants. Localities thus include everything from the largest cities to small areas with only 200 inhabitants.
Most of the localities are very small; 63 percent had fewer than 1 000 inhabitants. 124 localities or 6 percent of the total number had more than 10 000 inhabitants.
In 2015, 87 percent of the country's population lived in localities. During the most recent five-year period 2010-2015, the population in localities has increased by 5 percent. This corresponds to roughly 440 000 persons.
Since the year 1800 the number of inhabitants in localities has increased steadily. The increase was the sharpest during the period 1920-1970, when the population of localities increased by 5 million persons. The population outside of localities increased up until 1880, and then dropped. From 1970, the decreasing curve levelled out and between 1980 and 1990 the population outside of localities increased by slightly more than 20 000 persons.
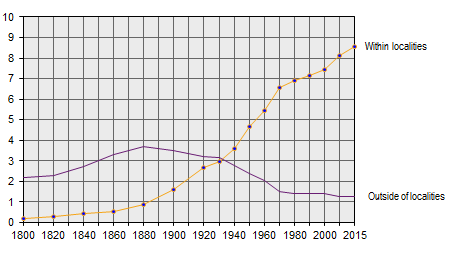
The population in localities in 2010 refers to those registered in 2010 within the locality boundaries of 2015.
Largest increase in the largest cities
The largest part of the increase since 2010 is in the largest localities. In 2015 nearly one third of Sweden's population lived in one of the country's nine largest localities, that is, those cities with more than 100 000 inhabitants. Helsingborg is the most recent locality that has exceeded 100 000 inhabitants.
In 2015, 13 percent or 1.3 million of the country's population lived outside of localities. Compared with 2010, this was a decrease of 5 000 persons.
| Type of area | Population 2015 | Proportion of total population in Sweden |
|---|---|---|
| In localities total | 8 572 514 | 87 |
| of whom in localities with population | ||
| 200–499 inh. | 257 404 | 3 |
| 500–999 inh. | 312 308 | 3 |
| 1 000–1 999 inh. | 414 735 | 4 |
| 2 000–4 999 inh. | 703 738 | 7 |
| 5 000–9 999 inh. | 721 105 | 7 |
| 10 000–19 999 inh. | 888 306 | 9 |
| 20 000–49 999 inh. | 1 258 902 | 13 |
| 50 000–99 999 inh. | 893 380 | 9 |
| ≥100 000 inh. | 3 122 636 | 32 |
| outside of localities | 1 278 503 | 13 |
| Total in Sweden | 9 851 017 | 100 |
Localities comprise 1.5 percent of Sweden's land area
The surface of localities comprises 1.5 percent of Sweden's total area. Stockholm County had the largest proportion of surface of localities at 14 percent, while Norrbotten County had the lowest at 0.2 percent.
Sweden's localities had an average population density of nearly 1 400 persons per square kilometre. Since 2010 density has increased by 72 persons per square kilometre. The highest population density in localities was in Stockholm County, where the average was 2 500 persons per square kilometre. The population in Dalarna County had the largest space at 640 inhabitants per square kilometre.
Publication
A more detailed report of this survey is published in a Statistical Report.
Next publishing will be
The next statistical news in this series will be published in March 2017.
Feel free to use the facts from this statistical news but remember to state Source: Statistics Sweden.