Localities and urban areas 2018: Population 2019
Densification in half of Sweden’s urban areas
Statistical news from Statistics Sweden 2020-03-24 9.30
In 2019, more than half of Sweden’s just over 2000 statistical localities noted population increases. At the same time, the number of inhabitants declined in nearly 900 localities. In just under 50 localities, the number of inhabitants remained unchanged at the end of 2019.
Statistics Sweden did not alter any statistical locality boundaries in 2019, which means that any increase in the number of inhabitants in a locality is defined as densification, expressed as the number of inhabitants per square kilometre. At the end of 2019, average population density in statistical localities was 1 437 inhabitants per square kilometre, which is 14 persons more than in 2018.
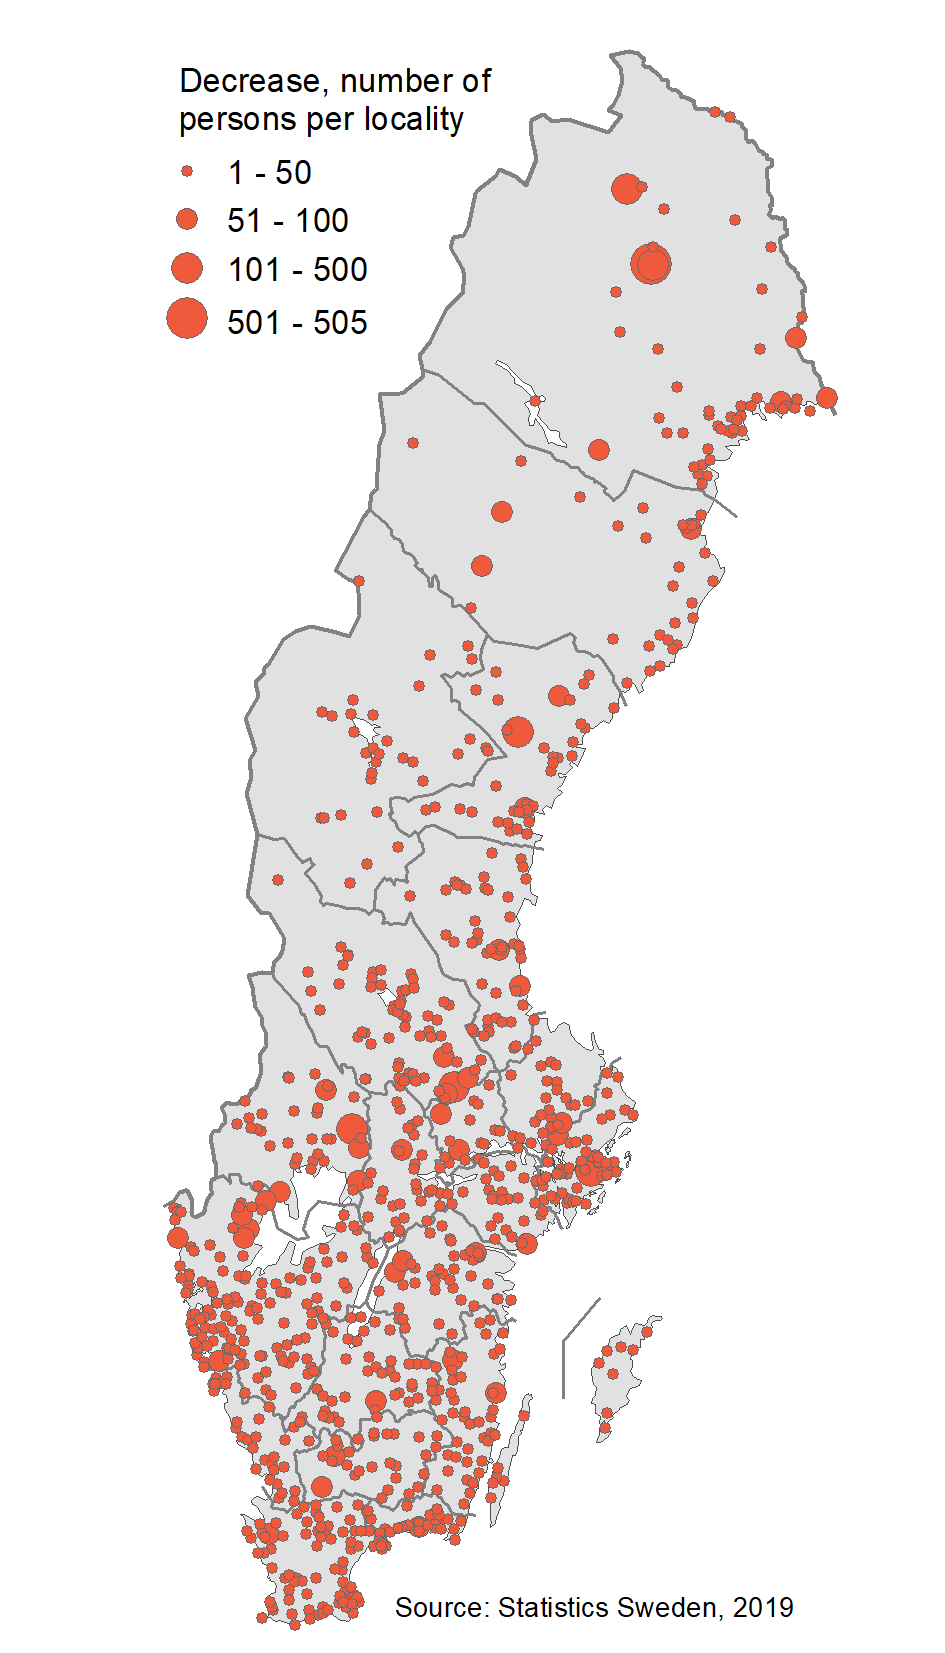
Densification and depopulation occurred within localities in all regions in Sweden. The maps below show population decline and increase in localities in 2019. The upper map shows the localities with population decline. Each dot represents one locality. The map shows that they are evenly distributed across the country. Substantial declines, indicated by larger dots, are more frequent in the inner parts of the country. There are some major declines in the inner parts of Norrbotten and Västerbotten, to the west of lake Vänern and the Bergslagen area.
The statistical localities in the eastern and western parts of Malmberget and Sollefteå noted the largest population declines in 2019. The population in both parts of Malmberget declined by 750 persons in total, which corresponds to one third of their population in 2018. This decline is the result of a community transformation under way in the area, in which the locality is gradually relocating to the neighbouring locality of Gällivare as a result of mining activities in Malmberget. During the same period, the population in Gällivare locality increased by nearly 240 persons.

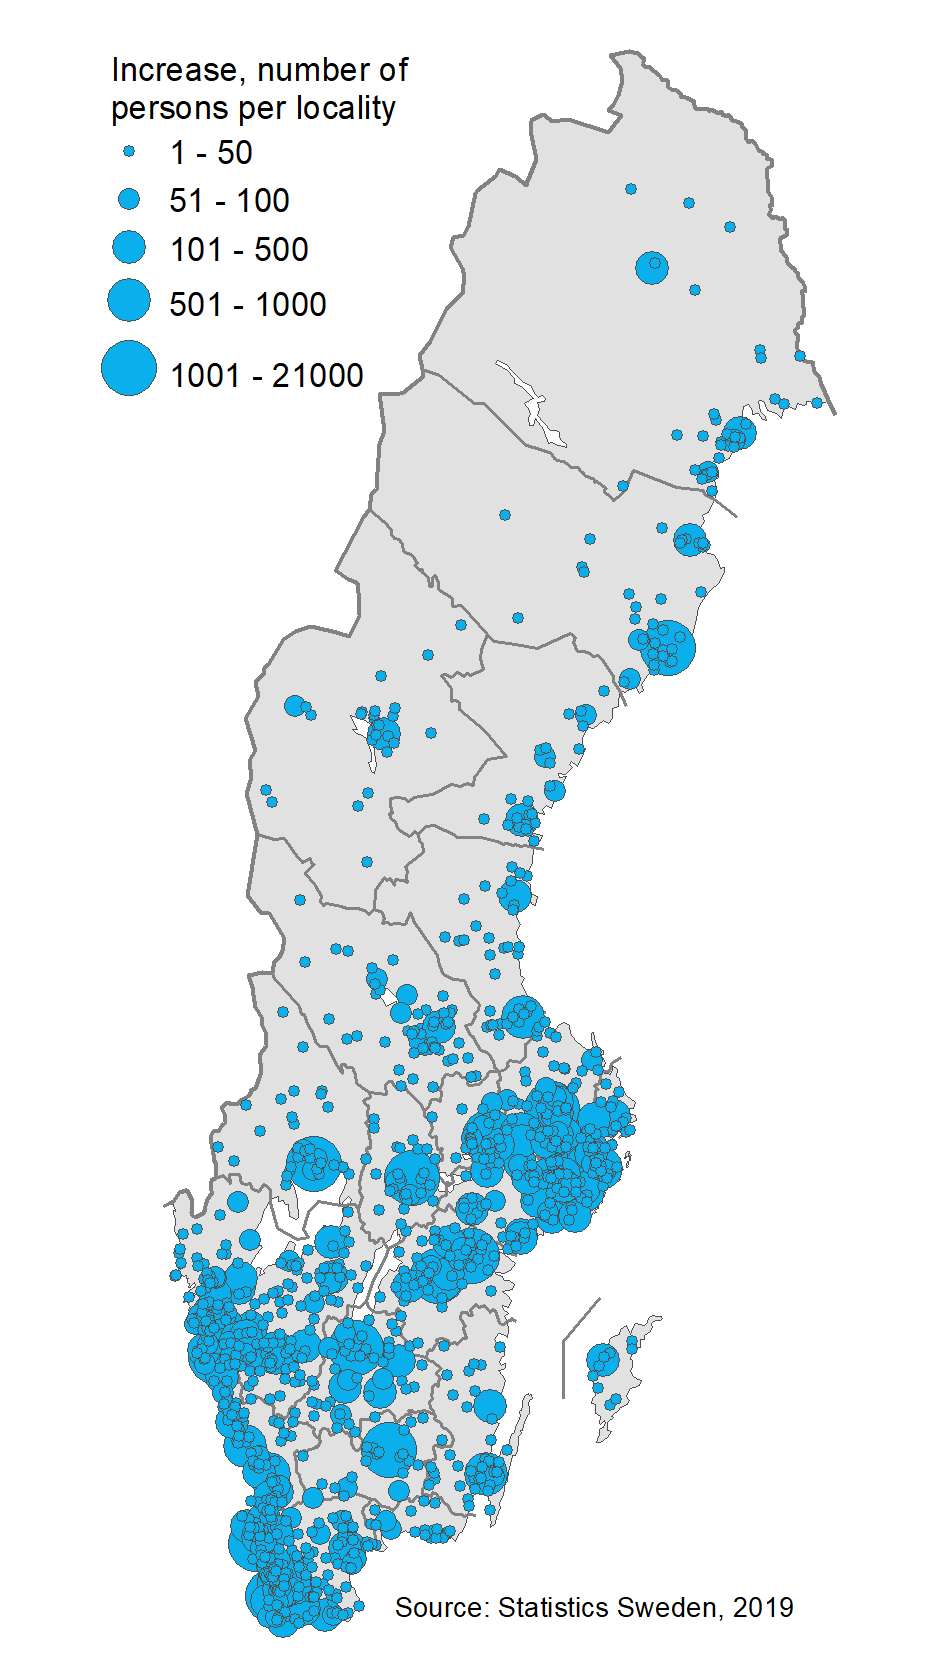
The map below shows localities with increased population density due to population increase within Statistics Sweden’s locality boundaries. These are represented by blue dots, in which the size of the dot indicates the size of the population increase. Although densification occurs throughout the country, the dots are concentrated to the areas in Sweden with the largest urban areas and regional centres. Above all, there are large concentrations in the Mälardalen area, and in a swath from the Göteborg region to western Skåne. In the northern parts of the country, there are many population increases around major localities and regional centres, which are mostly located along the coast.

There are several interesting patterns within counties. In Dalarna County, there is intense densification in the area around Falun and Borlänge, while population declines are noted in several localities around Siljan lake and in the north-west parts of Dalarna County. In Jämtland County, localities in areas around Östersund and Åre are increasingly densified. At the same time, many localities south of Storsjön lake noted population declines.
Definitions and explanations
In Statistics Sweden’s statistics, a locality refers to a continuous settlement with at least 200 inhabitants. Statistics Sweden delimits localities geographically and statistics are based on these localities. Settlement density is measured using digital maps from Lantmäteriet that contain information on buildings, properties, roads and land. The distance between buildings in a locality is measured based on several factors, including the number of people in the population register and employees in the various parts of the locality. The largest possible distance is 500 metres. Information on population and employees is collected from Statistics Sweden’s register and is combined with information on addresses.
“Statistical locality” is a concept used in statistics to indicate that the statistics are based on register data and other statistics. Statistics Sweden’s localities may therefore differ from definitions and delimitations of Swedish localities in other parts of society.
Population in localities 2019 was calculated using the 2018 locality boundaries. This means that:
- Persons living in settlements that have emerged outside the 2018 locality boundaries are not included in the statistics.
- There may be localities with a population of fewer than 200 inhabitants, since the number of localities is unchanged from 2018.
- Small locality groups that were not classified as localities in 2018 because the population was too small, but in which the population has since increased to 200 inhabitants or more, are not included.
- In practice, a change in the population in 2019 within the 2018 locality boundaries is a change in population density – densification or depopulation. It does not necessarily imply an increase or decrease in population size. This item of statistical news uses the concepts “densification” and “decline”.
Next publishing will be
The next statistical news in this series will be published in 2021.
Feel free to use the facts from this statistical news but remember to state Source: Statistics Sweden.
