Shareholder statistics, December 2016:
Share wealth reached a new record level
Statistical news from Statistics Sweden and Swedish Financial Supervisory Authority 2017-03-01 9.30
Shares listed on the Swedish marketplace were valued at SEK 6 479 billion at the end of 2016. This is an increase of SEK 400 billion in a year. A positive stock market trend contributed, while the number of listed companies rose to their highest level yet.
Share wealth, the value of listed companies on the Swedish marketplace including these companies’ unlisted classes of shares, increased by SEK 400 billion in 2016, and amounted to SEK 6 479 billion at the end of the year. According to Affärsvärlden’s general index, the Stockholm Stock Exchange rose by 6 percent in the year, and 134 companies were newly listed, while 56 companies were delisted. At the end of the year, there were 720 listed companies listed on the Swedish marketplace.
Average share portfolio far from median
Swedes’ average share portfolio of directly owned shares amounted to SEK 517 000. The median – the middle portfolio – lay considerably lower, at SEK 30 000. The big difference is explained by skewed ownership, in which a small number of shareholders own portfolios that are considerably larger than the average. At the end of 2016, the five percent with the largest holdings owned roughly 79 percent of the share wealth.
Women own one third and men own two thirds of directly owned shares. Persons over 64 years own more than half of the assets, while those below 35 years own less than 20 percent. The compilation includes all Swedish individuals who could be identified as shareholders. This means that holdings in shares registered in security accounts where information about the final owner is not available are not included. These holdings account for around nine percent of households’ total ownership.
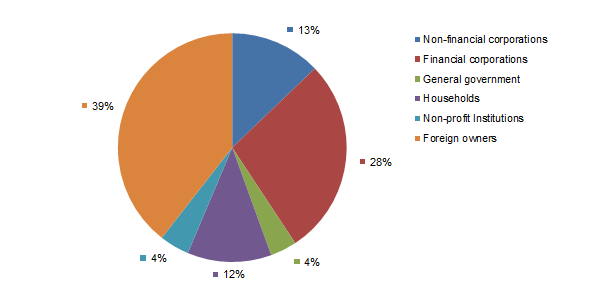
Foreign owners sector has the largest holdings
Foreign investors remain as the largest ownership sector, with holdings of around 40 percent. Next, non-financial corporations, investment funds and households were the largest shareholder sectors, with around 12 percent each.
Foreign ownership in shares on the Swedish market continued to increase in 2016. In total, foreign investors’ holdings in Swedish shares amounted to SEK 2 556 billion at the end of December 2016. This is nearly a doubling from 2011. The largest growth was among investors in Asia, but from a low level. Next, North American holdings have increased most, with an increase of 105 percent since 2011. Investors in the United States and the United Kingdom together owned more than 50 percent of foreign holdings. Both countries' holdings increased in 2016.
| Year | Non-financial enterprises | Financial enter-prises | Central govern-ment | Local govern-ment | Social-security funds | House-holds | Non-profit organisation | Foreign owners | Total value, SEK billion |
|---|---|---|---|---|---|---|---|---|---|
|
2016 Dec
|
12.8 | 27.9 | 1.1 | 0.0 | 2.6 | 11.9 | 4.2 | 39.4 | 6 479 |
|
2016 Jun
|
13.7 | 27.1 | 1.3 | 0.0 | 2.7 | 12.3 | 4.1 | 38.8 | 5 745 |
|
2015 Dec
|
13.5 | 26.6 | 1.4 | 0.0 | 2.5 | 11.9 | 4.1 | 40.0 | 6 079 |
|
2015 Jun
|
12.2 | 27.2 | 1.6 | 0.0 | 2.5 | 11.2 | 4.2 | 41.0 | 6 000 |
|
2014 Dec
|
12.4 | 27.8 | 1.8 | 0.0 | 2.6 | 11.1 | 4.4 | 39.9 | 5 542 |
|
2014 Jun
|
12.0 | 27.8 | 1.9 | 0.0 | 2.6 | 11.2 | 4.4 | 40.0 | 5 187 |
|
2013 Dec
|
11.9 | 26.9 | 2.0 | 0.0 | 2.8 | 10.9 | 4.4 | 41.0 | 5 010 |
|
2013 Jun
|
11.4 | 27.4 | 2.5 | 0.0 | 3.0 | 10.9 | 4.3 | 40.5 | 4 272 |
|
2012 Dec
|
11.5 | 27.6 | 2.9 | 0.0 | 2.8 | 10.8 | 4.1 | 40.3 | 4 039 |
|
2012 Jun
|
12.1 | 27.2 | 3.1 | 0.0 | 3.1 | 11.3 | 4.0 | 39.2 | 3 715 |
|
2011 Dec
|
12.0 | 27.8 | 3.1 | 0.0 | 3.3 | 11.2 | 3.9 | 38.7 | 3 611 |
|
2011 Jun
|
11.5 | 29.1 | 3.0 | 0.0 | 3.0 | 11.4 | 3.9 | 38.1 | 4 185 |
|
2010 Dec
|
9.2 | 28.7 | 3.8 | 0.0 | 3.1 | 13.3 | 4.1 | 37.8 | 4 342 |
|
2010 Jun
|
8.9 | 28.9 | 4.1 | 0.0 | 3.2 | 13.7 | 4.1 | 37.1 | 3 701 |
|
2009 Dec
|
9.1 | 29.1 | 4.7 | 0.0 | 3.4 | 13.9 | 4.3 | 35.4 | 3 518 |
|
2009 Jun
|
9.5 | 27.8 | 4.7 | 0.1 | 3.5 | 14.5 | 4.3 | 35.8 | 2 852 |
|
2008 Dec
|
9.5 | 27.4 | 4.6 | 0.1 | 3.5 | 14.5 | 4.6 | 35.8 | 2 313 |
|
2008 Jun
|
10.2 | 27.3 | 4.2 | 0.1 | 3.7 | 13.7 | 4.5 | 36.4 | 3 182 |
|
2007 Dec
|
9.4 | 26.9 | 4.5 | 0.1 | 3.2 | 13.4 | 4.4 | 38.0 | 4 064 |
|
2007 Jun
|
9.0 | 27.6 | 3.7 | 0.1 | 3.1 | 14.0 | 4.7 | 37.9 | 4 734 |
|
2006 Dec
|
9.0 | 27.0 | 4.5 | 0.1 | 3.2 | 14.3 | 4.8 | 37.2 | 4 425 |
|
2006 Jun
|
9.9 | 27.9 | 4.2 | 0.1 | 3.2 | 14.4 | 4.7 | 35.6 | 3 665 |
|
2005 Dec
|
8.4 | 28.6 | 4.4 | 0.1 | 3.5 | 14.8 | 4.8 | 35.3 | 3 627 |
|
2005 Jun
|
8.3 | 28.9 | 4.5 | 0.1 | 3.7 | 15.3 | 4.5 | 34.6 | 3 054 |
|
2004 Dec
|
8.7 | 28.5 | 5.2 | 0.2 | 3.8 | 15.0 | 4.7 | 33.9 | 2 768 |
|
2004 Jun
|
8.0 | 29.6 | 4.6 | 0.2 | 4.0 | 14.8 | 4.6 | 34.1 | 2 586 |
|
2003 Dec
|
9.2 | 28.7 | 5.5 | 0.2 | 4.1 | 14.4 | 4.6 | 33.1 | 2 354 |
|
2003 Jun
|
8.8 | 29.3 | 5.6 | 0.2 | 4.3 | 14.5 | 4.8 | 32.4 | 1 953 |
|
2002 Dec
|
8.5 | 28.9 | 5.7 | 0.2 | 4.1 | 14.3 | 4.8 | 33.5 | 1 869 |
Definitions and explanations
Information refers to shares on the Stockholm exchange (except for the external list), Aktietorget, NGM's lists and First North. Unlisted classes of shares in listed companies are also included. Shares of foreign companies that are noted on the above mentioned marketplaces have been included in the statistics from 2000 onwards.
Publication
A more detailed report of this survey is published in a Statistical Report.
Statistical Database
More information is available in the Statistical Database
Feel free to use the facts from this statistical news but remember to state Source: Statistics Sweden.