Real estate prices up to and including February 2019
House prices declined
Statistical news from Statistics Sweden 2019-03-07 9.30
Real estate prices for one- or two-dwelling buildings declined by 1 percent in the last three-month period, from December 2018 to February 2019, compared with the previous period, from September to November 2018. In the last three-month period, from December 2018 to February 2019, prices remained unchanged on an annual basis compared with the same period one year previously.
Between the two most recent three-month periods, prices declined in 10 out of 21 counties, while rising prices were reported in 4 counties. The largest decline was reported in Västernorrland County at 5 percent, followed by Östergötland County and Jämtland County by 4 percent. The largest rise was reported in Blekinge County at 5 percent, followed by Norrbotten County at 3 percent. In the metropolitan areas of Greater Stockholm and Greater Gothenburg, prices rose by 1 percent, while prices in Greater Malmö remained unchanged.
On an annual basis, prices rose in 12 counties and declined in 7 counties. The largest increase was reported in Norrbotten County and Blekinge County at 7 percent. The largest decline in prices was reported in Västernorrland County at 5 percent, followed by Stockholm County and Västerbotten County at 4 percent. In the metropolitan areas of Greater Stockholm, Greater Gothenburg and Greater Malmö, price changes ranged from -4 percent to +2 percent.
The average price at the national level for one- or two-dwelling buildings in the period from December 2018 to February 2019 was just over SEK 3 million.
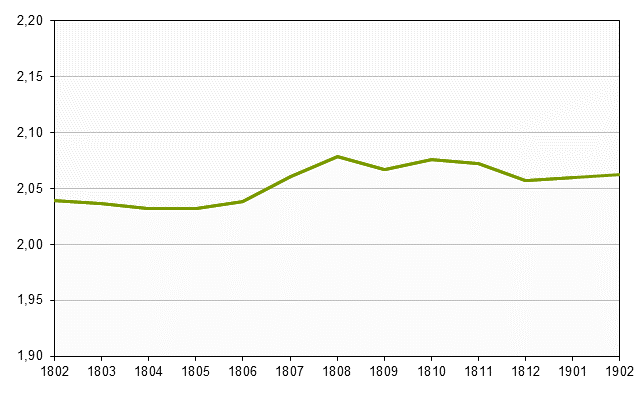
| Month | Number of purchases | Average price in SEK 1000 | Average assessed value in SEK 1000 | Purchase price coefficient (K/T) | Change in percent since previous month |
|---|---|---|---|---|---|
|
1802
|
3 888 | 3 169 | 1 608 | 2.04 | |
|
1803
|
4 300 | 3 069 | 1 561 | 2.04 | 0 |
|
1804
|
3 902 | 3 020 | 1 548 | 2.03 | 0 |
|
1805
|
4 315 | 3 020 | 1 548 | 2.03 | 0 |
|
1806
|
5 850 | 2 997 | 1 541 | 2.04 | 0 |
|
1807
|
4 846 | 2 724 | 1 391 | 2.06 | +1 |
|
1808
|
6 139 | 2 998 | 1 520 | 2.08 | +1 |
|
1809
|
3 910 | 2 744 | 1 388 | 2.07 | ‑1 |
|
1810
|
4 988 | 2 778 | 1 411 | 2.08 | 0 |
|
1811
|
5 818 | 2 891 | 1 468 | 2.07 | 0 |
|
1812
|
3 779 | 2 968 | 1 502 | 2.06 | ‑1 |
|
1901
|
3 388 | 3 212 | 1 632 | 2.06 | 0 |
|
1902[1]
|
1 742 | 2 984 | 1 504 | 2.06 | 0 |
[1] The figures are preliminary.
| Number of purchases latest period | Average price latest period (SEK 1000) | K/T latest period | K/T previous period | K/T previous year | Change in percent since previous period | Change in percent since previous year | |
|---|---|---|---|---|---|---|---|
|
County
|
|||||||
|
Stockholm
|
1 368 | 5 704 | 1.95 | 1.94 | 2.02 | +1 | -4 |
|
Uppsala
|
335 | 3 236 | 2.04 | 2.05 | 2.03 | 0 | +1 |
|
Södermanland
|
291 | 2 603 | 2.08 | 2.11 | 2.12 | -2 | -2 |
|
Östergötland
|
390 | 2 940 | 2.16 | 2.24 | 2.14 | -4 | +1 |
|
Jönköping
|
364 | 2 063 | 2.10 | 2.11 | 2.13 | 0 | -1 |
|
Kronoberg
|
199 | 2 146 | 2.06 | 2.04 | 1.96 | +1 | +5 |
|
Kalmar
|
290 | 1 714 | 2.02 | 2.06 | 2.02 | -2 | 0 |
|
Gotland
|
62 | 2 906 | 2.00 | 2.05 | 2.07 | -2 | -3 |
|
Blekinge
|
171 | 2 025 | 2.08 | 1.99 | 1.95 | +5 | +7 |
|
Skåne
|
1 370 | 3 042 | 1.97 | 1.97 | 1.93 | 0 | +2 |
|
Halland
|
317 | 3 211 | 1.99 | 2.00 | 1.96 | -1 | +2 |
|
Västra Götaland
|
1 493 | 3 210 | 2.11 | 2.11 | 2.10 | 0 | 0 |
|
Värmland
|
269 | 1 768 | 2.04 | 2.04 | 2.00 | 0 | +2 |
|
Örebro
|
306 | 1 876 | 2.08 | 2.11 | 2.06 | -1 | +1 |
|
Västmanland
|
287 | 2 584 | 2.18 | 2.19 | 2.13 | 0 | +2 |
|
Dalarna
|
272 | 1 699 | 2.18 | 2.17 | 2.23 | 0 | -2 |
|
Gävleborg
|
303 | 1 807 | 2.16 | 2.20 | 2.15 | -2 | +1 |
|
Västernorrland
|
234 | 1 515 | 2.07 | 2.17 | 2.17 | -5 | -5 |
|
Jämtland
|
99 | 1 859 | 2.01 | 2.09 | 1.96 | -4 | +3 |
|
Västerbotten
|
256 | 2 372 | 2.20 | 2.27 | 2.28 | -3 | -4 |
|
Norrbotten
|
233 | 1 621 | 2.22 | 2.16 | 2.07 | +3 | +7 |
|
Metropolitan areas
|
|||||||
|
Greater Stockholm
|
1 368 | 5 704 | 1.95 | 1.94 | 2.02 | +1 | -4 |
|
Greater Gothenburg
|
787 | 4 513 | 2.06 | 2.05 | 2.06 | +1 | 0 |
|
Greater Malmö
|
597 | 3 913 | 1.98 | 1.98 | 1.94 | 0 | +2 |
|
The whole country
|
8 909 | 3 064 | 2.06 | 2.07 | 2.05 | -1 | 0 |
Periods: Latest period 2018-12 – 2019-02, Previous period 2018-09 – 2018-11, Previous year 2017-12 – 2018-02.
| Code | Municipality | Number of purchases latest period | Average price latest period (SEK 1000) | K/T latest period | K/T previous period | K/T previous year | Change in percent since previous period | Change in percent since previous year |
|---|---|---|---|---|---|---|---|---|
|
0123
|
Järfälla
|
48 | 4 923 | 1.98 | 1.91 | 2.05 | +4 | -4 |
|
0126
|
Huddinge
|
82 | 5 329 | 1.95 | 1.90 | 2.04 | +2 | -4 |
|
0127
|
Botkyrka
|
68 | 4 271 | 1.97 | 1.93 | 2.03 | +2 | -3 |
|
0136
|
Haninge
|
95 | 4 239 | 1.99 | 1.99 | 2.02 | 0 | -2 |
|
0160
|
Täby
|
84 | 6 819 | 1.95 | 1.88 | 2.03 | +4 | -4 |
|
0163
|
Sollentuna
|
57 | 6 720 | 1.93 | 1.85 | 2.08 | +5 | -7 |
|
0180
|
Stockholm
|
214 | 7 020 | 1.95 | 1.90 | 1.99 | +2 | -2 |
|
0181
|
Södertälje
|
54 | 3 716 | 1.99 | 1.98 | 2.02 | 0 | -2 |
|
0182
|
Nacka
|
97 | 7 904 | 1.81 | 1.81 | 1.93 | 0 | -6 |
|
0188
|
Norrtälje
|
56 | 3 077 | 2.15 | 2.14 | 2.05 | 0 | +5 |
|
0380
|
Uppsala
|
135 | 4 125 | 1.98 | 2.03 | 1.95 | -2 | +2 |
|
0480
|
Nyköping
|
55 | 2 978 | 2.21 | 2.09 | 2.13 | +6 | +4 |
|
0484
|
Eskilstuna
|
85 | 2 739 | 2.09 | 2.19 | 2.12 | -5 | -2 |
|
0580
|
Linköping
|
133 | 3 780 | 1.97 | 2.10 | 2.07 | -6 | -5 |
|
0581
|
Norrköping
|
91 | 3 295 | 2.20 | 2.18 | 2.10 | +1 | +5 |
|
0680
|
Jönköping
|
94 | 3 370 | 2.04 | 2.16 | 2.22 | -6 | -8 |
|
0780
|
Växjö
|
75 | 3 298 | 1.95 | 1.97 | 2.02 | -1 | -3 |
|
0880
|
Kalmar
|
69 | 2 746 | 2.06 | 2.07 | 2.12 | 0 | -3 |
|
0980
|
Gotland
|
62 | 2 906 | 2.00 | 2.05 | 2.07 | -2 | -3 |
|
1080
|
Karlskrona
|
62 | 2 334 | 2.04 | 2.00 | 1.99 | +2 | +3 |
|
1280
|
Malmö
|
147 | 4 572 | 1.91 | 1.89 | 1.90 | +1 | 0 |
|
1281
|
Lund
|
87 | 4 254 | 2.02 | 2.02 | 1.87 | 0 | +8 |
|
1283
|
Helsingborg
|
118 | 3 916 | 1.83 | 1.87 | 1.76 | -2 | +4 |
|
1290
|
Kristianstad
|
93 | 2 176 | 2.09 | 1.99 | 2.02 | +5 | +4 |
|
1293
|
Hässleholm
|
63 | 1 386 | 2.10 | 2.07 | 2.08 | +1 | +1 |
|
1380
|
Halmstad
|
79 | 3 023 | 1.93 | 1.96 | 1.96 | -1 | -1 |
|
1383
|
Varberg
|
43 | 3 582 | 2.21 | 2.10 | 2.06 | +5 | +7 |
|
1384
|
Kungsbacka
|
100 | 4 514 | 1.95 | 1.89 | 1.96 | +3 | -1 |
|
1480
|
Göteborg
|
250 | 5 390 | 2.08 | 2.01 | 2.02 | +4 | +3 |
|
1481
|
Mölndal
|
54 | 5 134 | 2.05 | 2.04 | 2.00 | +1 | +2 |
|
1485
|
Uddevalla
|
48 | 2 835 | 2.02 | 1.92 | 1.93 | +5 | +5 |
|
1488
|
Trollhättan
|
66 | 2 445 | 2.07 | 2.30 | 2.14 | -10 | -3 |
|
1490
|
Borås
|
83 | 2 991 | 2.27 | 2.15 | 2.11 | +5 | +8 |
|
1496
|
Skövde
|
59 | 2 669 | 2.05 | 2.12 | 2.15 | -3 | -5 |
|
1780
|
Karlstad
|
73 | 2 916 | 2.03 | 2.10 | 2.01 | -3 | +1 |
|
1880
|
Örebro
|
87 | 3 105 | 1.94 | 1.98 | 1.93 | -2 | +1 |
|
1980
|
Västerås
|
144 | 3 371 | 2.06 | 2.04 | 2.03 | +1 | +2 |
|
2080
|
Falun
|
48 | 2 530 | 2.04 | 2.16 | 2.09 | -6 | -2 |
|
2081
|
Borlänge
|
39 | 2 354 | 1.91 | 1.94 | 1.97 | -1 | -3 |
|
2180
|
Gävle
|
101 | 2 830 | 2.13 | 2.20 | 2.09 | -3 | +2 |
|
2281
|
Sundsvall
|
84 | 2 399 | 2.18 | 2.28 | 2.27 | -4 | -4 |
|
2284
|
Örnsköldsvik
|
61 | 1 222 | 2.03 | 2.13 | 2.06 | -5 | -1 |
|
2380
|
Östersund
|
40 | 2 483 | 1.96 | 1.85 | 1.89 | +6 | +4 |
|
2480
|
Umeå
|
118 | 3 640 | 2.15 | 2.06 | 2.12 | +4 | +2 |
|
2482
|
Skellefteå
|
79 | 1 563 | 2.22 | 2.46 | 2.54 | -10 | -13 |
|
2580
|
Luleå
|
61 | 2 419 | 1.95 | 1.91 | 2.00 | +2 | -2 |
Definitions and explanations
Price changes are estimated using the purchase price coefficient (K/T). K/T is the ratio between the purchase price and the assessed value at a certain time and is reported as an unweighted mean value.
One- or two-dwelling buildings for permanent dwelling include detached one- or two-dwelling buildings, terraced houses and link-attached buildings. Real estate with site leasehold rights is included.
Source
The data is obtained from Lantmäteriet (the land registration authority).
Next publishing will be
2019-04-11 at 09:30.
Statistical Database
More information is available in the Statistical Database
Feel free to use the facts from this statistical news but remember to state Source: Statistics Sweden.