The Swedish Occupational Register with statistics 2015:
Uneven gender distribution among managers
Statistical news from Statistics Sweden 2017-03-08 9.30
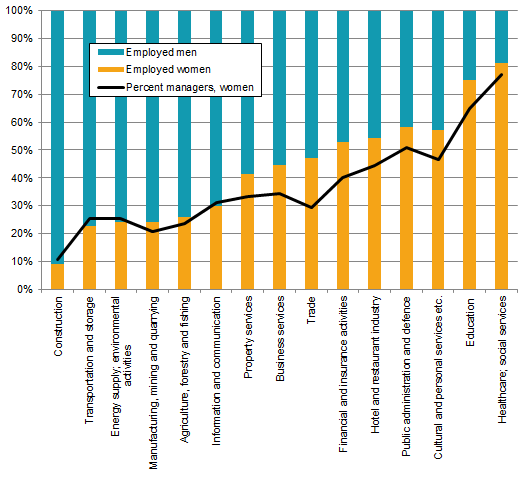
In total, among those employed as managers, 61 percent were men and 39 percent were women. Women managers were mainly present in occupational groups dominated by women, while men were present in occupational groups dominated by men, such as construction and manufacturing.
If the underlying gender distribution among employees in each industry is taken into account when looking at gender distribution among managers, it emerges that there is an unbalanced gender distribution in all except four industries, where the percentage of women among employees was almost the same as the percentage of women among managers (all manager groups are included).
The largest difference was in Trade. The percentage of women among employees was 47 percent, and the percentage of men was 53 percent, while the percentage of women among managers was 29 percent, and the percentage of men was 71 percent.
The smallest difference was present in the industries Energy supply; environmental activities, Information and communication and Construction, where the percentage of women among employees was nearly as high as among managers. The percentage of women among managers in the industry Transport and storage was two and a half percent higher than among employees. However, the proportion of women in these industries was low.
Nearly the same number of Swedish born as foreign born doctoral students, but low proportion of foreign born in first responder occupations
Table 1a shows the 15 occupations with the highest proportion of foreign born employees. In total, there were 619 000 foreign born employees aged 16-64 with occupational data. This corresponds to 15 percent of all employees.
The occupation with the largest percentage of foreign born persons, 69 percent, was Pizza bakers, followed by Cleaners, Other home service staff, etc. and Doctoral students. The latter occupations all had a relatively even distribution between Swedish born and foreign born persons, with about 50 percent each. However, this does not reflect the average proportion of foreign born persons on the labour market, which was 15 percent. In this respect, foreign born persons are over-represented in these occupations.
| Occupation1 | Total | Born in Sweden, number | Foreign born, number | Foreign born, percent |
|---|---|---|---|---|
|
Pizza bakers etc.
|
2 730 | 830 | 1 900 | 69 |
|
Cleaners
|
74 480 | 35 160 | 39 320 | 53 |
|
Other home service staff etc.
|
1 520 | 760 | 760 | 50 |
|
Doctoral students
|
12 680 | 6 490 | 6 190 | 49 |
|
Choreographers and dancers
|
300 | 160 | 140 | 47 |
|
Bus and tram drivers
|
23 190 | 13 200 | 9 990 | 43 |
|
Postdoctoral research fellows etc.
|
1 380 | 820 | 570 | 41 |
|
Taxi drivers etc.
|
10 700 | 6 400 | 4 300 | 40 |
|
Machine operators, beaching, dyeing and cleaning
|
2 870 | 1 730 | 1 140 | 40 |
|
Cleaning supervisors and head housekeepers
|
2 330 | 1 410 | 920 | 39 |
|
Butchers and cutters etc.
|
3 550 | 2 160 | 1 390 | 39 |
|
Doctors not elsewhere classified
|
4 680 | 2 900 | 1 780 | 38 |
|
Food processors not elsewhere classified
|
580 | 360 | 220 | 38 |
|
Leather workers and shoemakers
|
280 | 170 | 100 | 37 |
|
Advertising distributors and newspaper deliverers
|
7 250 | 4 600 | 2 650 | 37 |
|
Total
|
4 051 300 | 3 432 500 | 618 800 | 15 |
1) According to the Swedish Standard Classification of Occupations 2012 (SSYK2012) on the four-digit level. The figures are rounded to the nearest 10.
The occupations with the smallest percentage of foreign born persons were Officers and Non-commissioned officers, followed by Firefighters, in which two percent were foreign born persons. Among the 15 occupations with the smallest percentage of foreign born persons, there are several occupations that are often called 'first responder' professions. The list includes Police, Firefighters and Paramedics, which all have between two percent and four percent foreign born persons, which is lower than the average percentage for foreign born persons on the labour market, which was 15 percent. In that respect, foreign born persons are underrepresented in these professions.
| Occupation1 | Total | Born in Sweden, number | Foreign born, number | Foreign born, percent |
|---|---|---|---|---|
|
Commissioned officers
|
1 550 | 1 520 | 30 | 2 |
|
Non-commissioned officers
|
1 340 | 1 310 | 30 | 2 |
|
Firefighters
|
5 330 | 5 200 | 130 | 2 |
|
Air traffic controllers
|
720 | 700 | 20 | 3 |
|
Demolition workers
|
420 | 410 | 10 | 3 |
|
Real estate and head of administration managers, group 1
|
510 | 500 | 20 | 3 |
|
Forestry and agricultural production managers etc.
|
550 | 540 | 20 | 3 |
|
Other ranks (privates etc.)
|
6 810 | 6 590 | 220 | 3 |
|
Fishery workers
|
300 | 290 | 10 | 3 |
|
Paramedics
|
1 020 | 990 | 40 | 3 |
|
Plant and machine operators, rock crusher and ore processing plant
|
2 000 | 1 930 | 70 | 3 |
|
Engineer officer
|
710 | 680 | 30 | 4 |
|
Machine operators of agricultural and forestry equipment
|
6 510 | 6 270 | 230 | 4 |
|
Police
|
16 150 | 15 570 | 590 | 4 |
|
Operators etc.
|
15 000 | 14 410 | 590 | 4 |
|
Total
|
4 051 300 | 3 432 500 | 618 800 | 15 |
1) According to the Swedish Standard Classification of Occupations 2012 (SSYK2012) on the four-digit level. The figures are rounded to the nearest 10.
Percentage of foreign born women and men
Tables 1c and 1d show the 5 occupations with the largest percentage of foreign born women and men.
The occupation with the largest percentage of foreign born women was Well drillers etc. However, this is an occupation with extremely few women. This was followed by Other home service staff etc. where every second woman in the profession was foreign born. Cleaners and Choreographers and dancers had nearly the same distribution, in which the proportion of foreign born women was 48 percent.
Occupations with the smallest percentage of foreign born persons were topped by occupations with few women at all, such as Facility divers, Non-commissioned officers and Paramedics.
| Occupation1 | Total | Women, number | Foreign born women, number | Foreign born women of all women, percent |
|---|---|---|---|---|
|
Well drillers etc.
|
530 | 0 | 0 | 100 |
|
Other home service staff etc.
|
1 520 | 1 270 | 640 | 50 |
|
Cleaners
|
74 480 | 55 850 | 27 060 | 48 |
|
Choreographers and dancers
|
300 | 170 | 80 | 48 |
|
Doctoral students
|
12 680 | 5 970 | 2 700 | 45 |
1) According to the Swedish Standard Classification of Occupations 2012 (SSYK2012) on the four-digit level. The figures are rounded to the nearest 10.
The occupation with the highest percentage of foreign born men was Pizza bakers, in which 84 percent of men were foreign born, followed by Cleaners, in which there were 66 percent foreign born men. A large percentage of foreign born men were also present in occupations such as Dental hygienists, Tailors and seamstresses, etc. and Other beauty and body therapists. The four latter occupations are all dominated by women.
| Occupation1 | Total | Men, number | Foreign born men, number | Foreign born men of all men, percent |
|---|---|---|---|---|
|
Pizza bakers etc.
|
2 730 | 2 080 | 1 750 | 84 |
|
Cleaners
|
74 480 | 18 630 | 12 260 | 66 |
|
Dental hygienists
|
3 700 | 120 | 80 | 63 |
|
Tailors and seamstresses, etc.
|
820 | 120 | 80 | 62 |
|
Other beauty and body therapists
|
640 | 70 | 40 | 60 |
1) According to the Swedish Standard Classification of Occupations 2012 (SSYK2012) on the four-digit level. The figures are rounded to the nearest 10.
Occupations with the smallest percentage of foreign born persons among the men included Officers and Real estate and administration managers, which are occupations dominated by men, and School nurses and Dieticians, which are occupations dominated by women.
Definitions and explanations
The information refers to employees aged 16-64 who are classified as gainfully employed according to the definition in the register-based labour market statistics (RAMS). Classification of gainfully employed persons is based mainly on statements of earnings and tax declaration information from the Swedish Tax Agency. For classification as gainfully employed, the person must be registered in the population records on 31 December and have an income that exceeds an estimated limit or conduct active business operations. Even those who were temporarily absent during the measurement period, for instance due to sickness or parental leave, are included in the frame. The term employee also refers to self-employed persons who run their operations as a limited company.
The occupations follow the classifications used in the Swedish Standard Classification of Occupations (SSYK 2012)
Next publishing will be
The next press release in this series will be published in March 2018.
Statistical Database
More information is available in the Statistical Database
Feel free to use the facts from this statistical news but remember to state Source: Statistics Sweden.