The Swedish Occupational Register with statistics 2017:
Pizza makers have largest share of foreign born persons
Statistical news from Statistics Sweden 2019-03-07 9.30
Pizza makers is the occupation with the largest share of foreing born persons, 79 percent. This was also the occupation with the largest percentage of foreign born men, 88 percent. “Maid, nanny and related workers” was the occupation with the largest percentage, 68 percent, of foreign born women. This was followed by the occupation “cleaners and helpers in offices, hotels and other establishments”, in which foreign born women accounted for nearly 50 percent. Among employees aged 16-64 years, foreign born persons accounted for 17 percent.
The most common occupation in Sweden in 2017 was assistant nurses, personal care, home care and homes for the elderly, in which women accounted for 92 percent and men accounted for 8 percent. This was also the most common occupation among women. The most common occupation among men was commercial sales representatives, which was the fourth most common occupation in total; men accounted for 73 percent and women accounted for 27 percent.
| Occupation1) | Total | Number of native born | Number of foreign born | Foreign born, percent |
|---|---|---|---|---|
|
Pizza makers and fast food preparers
|
3 600 | 770 | 2 830 | 79 |
|
Maid, nanny and related workers
|
3 270 | 1 020 | 2 250 | 69 |
|
Translators, interpreters and other linguists
|
3 000 | 1 230 | 1 770 | 59 |
|
Cleaners and helpers in offices, hotels and other establishments
|
73 420 | 31 330 | 42 090 | 57 |
|
PhD Students
|
9 730 | 4 800 | 4 930 | 51 |
|
Bus and tram drivers
|
23 830 | 12 300 | 11 530 | 48 |
|
Taxi, car, and van drivers
|
11 330 | 5 990 | 5 330 | 47 |
|
Machine operators, bleaching, dyeing and cleaning
|
3 030 | 1 620 | 1 410 | 46 |
|
Choreographers and dancers
|
370 | 210 | 170 | 45 |
|
Research assistants
|
2 870 | 1 620 | 1 240 | 43 |
|
Butchers, fishmongers and related food preparers
|
3 400 | 1 930 | 1 470 | 43 |
|
Cleaning supervisors and housekeepers
|
2 450 | 1 430 | 1 020 | 42 |
|
Beauty and body therapists professionals not elsewhere classified
|
890 | 520 | 370 | 42 |
|
Machine operators, meat- and fish-processing
|
4 460 | 2 630 | 1 840 | 41 |
|
Restaurant and kitchen helpers
|
68 140 | 41 580 | 26 560 | 39 |
|
Total
|
4 270 900 | 3 537 000 | 733 900 | 17 |
1) According to the Swedish Standard Classification of Occupations 2012 (SSYK2012) at a four-digit level. Total number of persons with occupational data. The figures are rounded to the nearest 10.
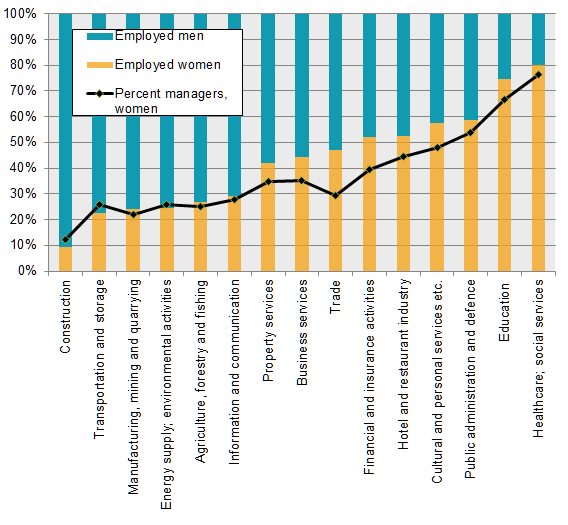
Good gender balance among managers on the whole, but uneven distribution in manager occupations
In total, among managers (not including politicians, senior officials and CEOs), 60 percent were men and 40 percent were women. Female managers were mainly present in occupational groups dominated by women, while men were present in occupational groups dominated by men, such as construction and manufacturing.
The largest percentage of female managers was present in education and in health and medical care, specifically in the occupations pre-school managers and managers in elderly care, in which 93 percent and 86 percent are women, respectively.
Production managers in construction and mining was the manager position with the largest percentage of men, 91 percent. Only 9 percent of managers in this area were women.
Manager functions in which there was an even gender balance included finance managers, information, communication and public relations managers and restaurant managers.
Taking account of the underlying gender balance among employees in each industry when looking at gender balance among managers shows an uneven gender balance in all except three industries, where the percentage of women among the employees was nearly as large as the percentage of women among the managers (all manager groups are included).
Occupations with employees from temporary employment agencies
Assemblers not elsewhere classified, is the occupation with the largest percentage of employed by temporary employment agencies.
Among assemblers not elsewhere classified, 25 percent were employed by a temporary staffing agency, which makes it the occupation with the largest percentage of temporary staff. This is followed by process control technicians, metal production and engineer officers with 21 percent and 20 percent respectively.
In occupations with large percentages of employees from temporary employment agencies there were gender imbalances, both overall in the occupations and among the employees from temporary employment agencies. Among aircraft pilots and related associate professionals, men accounted for 93 percent, and among pilots from staffing agencies, men also accounted for 93 percent. The only occupation with gender balance in both cases was customer service information clerks, in which men accounted for 40 percent and women accounted for 60 percent in the occupation as a whole. Gender distribution among customer service information clerks from temporary employment agencies was even more balanced, with 48 percent men and 52 percent women.
Pre-press technicians in particular stood out due to the large gender imbalance in the occupation as a whole and employees from temporary employment agencies; men accounted for 62 percent and women accounted for 38 percent in the occupation in total. Among employees from temporary employment agencies, instead, men accounted for 85 percent and women accounted for 15 percent.
| Occupation1) | Sex distribution, occupation | Sex distribution, temporary employment agencies | |||||
|---|---|---|---|---|---|---|---|
| Total number | Men, percent | Women, percent | Temporary employment agencies, percent | Men, percent | Women, percent | ||
|
Assemblers not elsewhere classified
|
10 890 | 76 | 24 | 25 | 74 | 26 | |
|
Metal production process controllers
|
2 720 | 85 | 15 | 21 | 80 | 20 | |
|
Ships' engineers
|
570 | 97 | 3 | 20 | 100 | 0 | |
|
Fork-lift drivers
|
12 240 | 86 | 14 | 19 | 83 | 17 | |
|
Cabin crew
|
2 450 | 21 | 79 | 17 | 24 | 76 | |
|
Back office-staff
|
2 170 | 37 | 63 | 16 | 38 | 62 | |
|
Railway, signal and switch operators
|
14 880 | 75 | 25 | 12 | 78 | 22 | |
|
Warehouse and terminal Staff
|
81 520 | 78 | 22 | 12 | 79 | 21 | |
|
Pre-press technicians
|
1 800 | 62 | 38 | 11 | 85 | 15 | |
|
Social work professions not elsewhere classified
|
2 510 | 33 | 67 | 11 | 35 | 65 | |
|
Aircraft pilots and related associate professionals
|
1 650 | 93 | 7 | 11 | 93 | 7 | |
|
Process control technicians not elsewhere classified
|
2 670 | 85 | 15 | 9 | 74 | 26 | |
|
Manufacturing labourers
|
11 660 | 63 | 37 | 9 | 76 | 24 | |
|
Customer Service Information Clerks
|
30 080 | 40 | 60 | 9 | 48 | 52 | |
|
Mechanical machinery assemblers
|
10 660 | 85 | 15 | 8 | 75 | 25 | |
1) Under the Swedish Standard Classification of Occupations 2012 (SSYK2012) at a four-digit level. The figures are rounded to the nearest 10, which means the shares do not always add up to 100. Refers to occupations with at least 100 people from staffing agencies. Code 78200 according to SNI2007 classification
Definitions and explanations
Information concerning employees is reported for those aged 16-64 years classified as gainfully employed in the register-based labour market statistics (RAMS). Classification of gainfully employed persons is based mainly on statements of earnings and tax declaration information from the Swedish Tax Agency. To be classified as gainfully employed, the person must have a salary income that exceeds an estimated threshold or operate business activities. In addition, the person must be entered in the population register in Sweden on 31 December and be between 16 and 74 years old. Even those who were temporarily absent during the measurement period, for instance due to sickness or parental leave, are included in the frame. The term ‘employee’ also includes self-employed persons who run their operations as a limited company.
The occupations follow the classifications used in the Swedish Standard Classification of Occupations (SSYK 2012).
Publication
A more detailed report on this survey is published in the Statistical Report:
Next publishing will be
The next statistical news in this series will be published in March 2020.
Statistical Database
More information is available in the Statistical Database
Feel free to use the facts from this statistical news but remember to state Source: Statistics Sweden.