Social security in Sweden 1993–2015:
Expenditure for social protection decreased slightly in relation to GDP
Statistical news from Statistics Sweden 2017-03-31 9.30
Social protection expenditures increased in 2015 in current prices, but decreased in relation to the GDP. In 2015, expenditures for social protection were 29.3 percent of the GDP. The corresponding figure for 2014 was 29.5 percent.
Total expenditures for social protection increased by SEK 63.7 billion, or about 5.5 percent in 2015. The corresponding increase between 2013 and 2014 was 2.6 percent.
As a share of GDP, expenditure for social protection has varied from year to year. In the whole period, the percentage fell from 36.1 percent in 1993 to 29.3 percent in 2015. Between 1993 and 2000, the share decreased steadily, and in 2000 it amounted to 28.3 percent. In the 2000s, the proportion varied between 27.4 percent (in 2007) and 30.4 percent (in 2003).
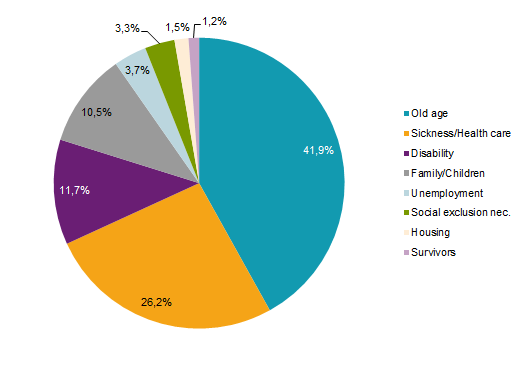
Expenditure on elderly was the largest expenditure item
The largest expenditure item was the elderly, which amounted to 42 percent of social benefits in 2015. The second largest expenditure item was health and medical care, with 26 percent of total social benefits. This is followed by expenditure on disability and family/children, which constitutes 12 and 10 percent of total social benefits respectively.
Expenditure on the elderly increased by SEK 24.7 billion in current prices, an increase of 5.2 percent between 2014 and 2015. The increase is significantly higher than between 2013 and 2014, when the brake in the retirement system meant that many pensioners received lower income- and supplementary pension. The increased costs are nearly the same as in 2012 and 2013. Old age pension, which is the largest item of expenditure on old age, increased by 5.2 percent in 2015. Benefits in kind, such as accommodation and personal assistance, also increased.
Expenditure on health and medical care increased by SEK 18.2 billion, or about 6.1 percent. The expenditures for paid sick leave account for the largest increase, about 12.4 percent. The sickness benefit paid for by the Social Insurance Agency increased by 13.9 percent compared with 2014 and sick pay from employers increased by 12.2 percent.
Expenditure on unemployment increased by SEK 0.3 billion in 2015 compared with 2014, an increase of 0.7 percent. The payment of unemployment benefits decreased by SEK 1.0 billion, while the cost of introduction benefit for newly arrived people in Sweden increased by SEK 0.8 billion. Vocational training and job placement and counselling also decreased, by SEK 0.7 billion and SEK 0.5 billion respectively.
Social exclusion only accounts for about 3 percent of the total expenditure for social protection, but was the function that increased the most in percentage terms between 2014 and 2015, when it increased by 33.5 percent (SEK 10.0 billion). The cost increase is largely explained by higher costs for asylum accommodation, which was due to a very large increase in the number of asylum seekers at the end of 2015.
Expenditure on disability increased by SEK 3.8 billion in 2015 compared with 2014, an increase of 2.8 percent. The disability pension decreased by 2.9 percent, while accommodation and personal assistance increased by 4.0 percent and 6.0 percent respectively.
Expenditure on family and children increased by 4.0 percent, while expenditure on housing increased by 1.8 percent between 2014 and 2015.
| Function | 2010 | 2011 | 2012 | 2013 | 2014 | 2015 |
|---|---|---|---|---|---|---|
| 1. Sickness/ Health care |
247 097 | 260 242 | 270 422 | 281 976 | 296 911 | 315 130 |
| 2. Disability | 134 086 | 132 486 | 132 783 | 135 249 | 136 398 | 140 189 |
| 3. Old Age | 399 970 | 417 419 | 442 767 | 470 415 | 478 828 | 503 512 |
| 4. Survivors | 17 190 | 16 362 | 16 131 | 15 632 | 14 681 | 14 081 |
| 5. Family/Children | 103 405 | 107 640 | 111 726 | 116 673 | 120 697 | 125 570 |
| 6. Unemployment | 45 461 | 39 873 | 43 633 | 47 184 | 43 765 | 44 075 |
| 7. Housing | 15 282 | 15 551 | 16 869 | 17 317 | 18 291 | 18 614 |
| 8. Social exclusion nec. | 23 640 | 23 767 | 24 519 | 26 592 | 29 824 | 39 821 |
| Expenditures for social protection benefits | 986 131 | 1 013 340 | 1 058 850 | 1 111 038 | 1 139 395 | 1 200 992 |
| As a % of GDP | 28.0 | 27.7 | 28.7 | 29.5 | 28.9 | 28.7 |
| Administration costs/Other expenditures | 19 029 | 19 495 | 20 815 | 21 215 | 22 412 | 24 469 |
| Social protection expenditure | 1 005 160 | 1 032 835 | 1 079 665 | 1 132 253 | 1 161 807 | 1 225 461 |
| As a % of GDP | 28.6 | 28.2 | 29.3 | 30.0 | 29.5 | 29.3 |
International comparisons
In the early 1990s, Sweden had the highest social protection expenditure in relation to GDP compared with other countries in the EU. In recent years, Sweden has placed just below the EU average. In 2014, France had the highest level of expenditure for social protection as a share of GDP, with 34.3 percent. Denmark had the second highest level of expenditure for social protection, with 32.9 percent of GDP. Latvia, Lithuania and Romania were the EU countries with the smallest share, about 15 percent.
Country |
2010 |
2011 |
2012 |
2013 |
2014 |
||||||
|---|---|---|---|---|---|---|---|---|---|---|---|
Belgium |
29.4 | 29.7 | 29.6 | 30.1 | 30.3 | ||||||
Denmark |
32.4 | 32.1 | 32.0 | 32.5 | 32.9 | ||||||
Finland |
29.3 | 28.9 | 30.1 | 31.1 | 31.9 | ||||||
France |
32.9 | 32.7 | 33.5 | 33.9 | 34.3 | ||||||
Greece |
26.2 | p |
27.7 | p |
28.2 | p |
26.7 | p |
26.0 | p |
|
Ireland |
24.0 | 23.5 | 23.2 | 22.3 | 20.6 | ||||||
Italy |
28.9 | 28.5 | 29.3 | 29.8 | p |
30.0 | p |
||||
Luxembourg |
22.7 | 21.9 | 22.8 | 23.2 | 22.7 | ||||||
The Netherlands |
29.7 | 30.2 | 31.0 | 31.2 | 30.9 | ||||||
Portugal |
25.8 | 25.8 | 26.4 | 27.6 | 26.9 | ||||||
Spain |
24.6 | p |
25.3 | p |
25.5 | p |
25.8 | p |
25.4 | p |
|
United Kingdom |
29.1 | 29.1 | 29.2 | 28.4 | 27.4 | p |
|||||
Sweden |
28.6 | 28.2 | 29.3 | 30.0 | 29.5 | ||||||
Germany |
29.8 | 28.6 | 28.7 | 29.0 | 29.1 | p |
|||||
Austria |
29.8 | 29.0 | 29.3 | 29.8 | 30.0 | ||||||
Total for the EU15 |
29.4 | p |
29.1 | p |
29.5 | p |
29.7 | p |
29.5 | p |
|
Cyprus |
19.9 | 21.5 | 22.3 | 24.2 | 23.0 | ||||||
Estonia |
17.6 | 15.6 | 15.0 | 14.9 | 15.1 | ||||||
Latvia |
18.3 | 15.4 | 14.4 | 14.6 | 14.5 | p |
|||||
Lithuania |
18.9 | 16.9 | 16.3 | 15.3 | 14.7 | p |
|||||
Malta |
19.3 | 18.9 | 19.1 | 18.9 | 18.2 | ||||||
Poland |
19.7 | p |
18.7 | 18.9 | 19.4 | 19.0 | |||||
Slovakia |
18.2 | 17.8 | 18.0 | 18.3 | 18.5 | p |
|||||
Slovenia |
24.4 | 24.5 | 24.9 | 24.9 | 24.1 | p |
|||||
Czech Republic |
20.1 | 20.1 | 20.4 | 20.2 | 19.7 | ||||||
Hungary |
22.6 | 21.7 | 21.4 | 20.8 | 19.9 | ||||||
Total for the EU25 |
28.8 | p |
28.5 | p |
28.9 | p |
29.1 | p |
28.9 | p |
|
Bulgaria |
17.0 | 16.5 | 16.6 | 17.6 | 18.5 | ||||||
Croatia |
20.8 | 20.4 | 21.1 | 22.0 | 21.6 | ||||||
Romania |
17.3 | 16.4 | 15.4 | 14.9 | 14.8 | ||||||
Total for the EU28 |
28.6 | p |
28.3 | p |
28.7 | p |
28.9 | p |
28.7 | p |
|
Iceland |
23.3 | 23.9 | 23.7 | 23.4 | 23.9 | ||||||
Norway |
25.1 | 24.8 | 24.5 | 25.0 | 26.0 | ||||||
Switzerland |
25.5 | 25.4 | 26.3 | 27.0 | 27.1 | ||||||
Serbia |
23.9 | 22.7 | 24.0 | 23.3 | 23.4 | ||||||
Turkey |
13.5 | 13.2 | 13.8 | b |
14.1 | 14.1 | p |
||||
p) provisional data b) break in time series. Sweden has been updated with the latest figures.
The different taxation regulations pose a major problem for international comparisons. Some countries regulate taxes on certain benefits, while others do not. In addition, some benefits in certain countries consist of tax deductions, while other countries pay the benefit directly.
Slightly more than half of the social protection benefits in Sweden are cash benefits. Most of these cash benefits are taxable. If taxation is taken into account, the percentage of GDP from benefits in 2015 fell from 28.7 percent including tax to 25.4 percent excluding tax.
This data are also available in a database on Eurostat’s website under: Population and social conditions - Social protection.
Definitions and explanations
Social protection is defined here as all services from public or private organisations with the purpose of reducing the burden on households and individuals from specially defined risks or meeting specially defined needs. A prerequisite is that these services do not require a return of services and that they are not based on individual arrangements. The benefits may be either in cash or in kind.
Feel free to use the facts from this statistical news but remember to state Source: Statistics Sweden.