Cohort mortality in Sweden Mortality up to and including 2019
Growing number of people live longer
Statistical news from Statistics Sweden 2020-06-23 9.30
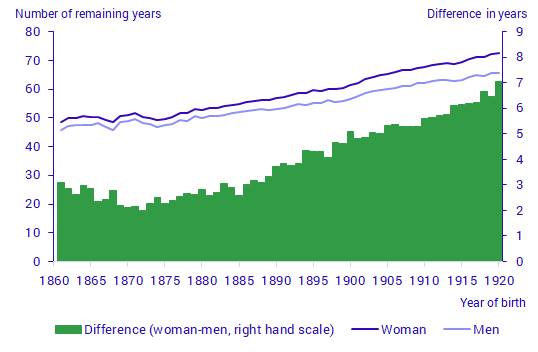
Women born in 1920 lived for 73 years on average, which is 24 years more than women born in 1865, who lived to be 49 years on average. For men, the corresponding increase was 20 years, from 46 to 66 years.
In a new report, “Cohort mortality in Sweden — Mortality up to and including 2019”, Statistics Sweden describes how mortality rates have changed for persons with different years of birth.
Significant drop in child mortality
A comparison in mortality rates between different birth cohorts shows a clear drop in mortality in all ages 0–99 years. This leads to an increase in the number of lived years on average, that is, life expectancy. Infant mortality, that is, the number of persons deceased in the first year after birth as a proportion of the number of live births, has dropped from around 20 percent in the first half of the 1700s to around 0.2 percent in the 2010s. Infant mortality has been higher for boys than for girls, but this difference between the sexes is almost non-existent in the 2000s.
The dropping infant mortality rates greatly contributed to the rising average life expectancy by birth cohort. In total, average life expectancy increased by 24 years for women and by 20 years for men between the birth years 1865 and 1920. Just over 10 years of this increase are due to lower mortality among children below five years old.

Death rates fell more among women than among men
The gap in mortality rates between women and men narrowed distinctly from those born in 1875 to those born in 1920. Mortality rates decreased more among women than among men at every age between 45 and 95 years. This resulted in an increase in the difference in average life expectancy between women and men from around 2 years among those born in the mid-1870s to 7 years among those born in 1920.
Changes in life style, such as smoking and alcohol consumption, contributed to the widening gap between the sexes up to the birth years in the first decades of the 1900s. There was a higher proportion of smokers among men than among women in all birth cohorts born in the 1800s up to those born in the 1920s. Women have never smoked as much as men. However, for women and men born in the 1940s and onwards, daily smoking has been roughly equally common among women and men, or more common among women.

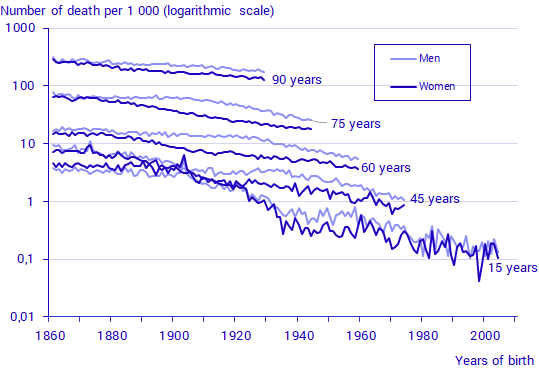
A logarithmic scale is used to enable showing death rates by birth year for different ages at the same time. Mortality at age 90 was just over 250 per 1 000 women born in the 1860s. This was nearly halved, 128 per 1 000, for women born in 1929. At age 60, the mortality rate was around 15 per 1 000 men born in the 1860s, but dropped to 5 per 1 000 for men born in 1959. Note that mortality rates for persons born around 1900 were roughly the same at age 15 and age 45, that is, 4 per 1 000. The heightened mortality rates among persons aged 15 born in 1903 and among persons aged 45 born in 1873 were the result of the 1918 flu pandemic.
Mortality rates are higher among men than among women in nearly all ages and birth cohorts. There is an exception at age 15, where the mortality rate for persons born between 1861 and 1919 is higher among girls than among boys. This is mainly because, for a long time, mortality rates from tuberculosis were higher among girls than among boys. Once the number of deaths from tuberculosis gradually declined in the 1900s, the heightened mortality rate among girls aged 15 also gradually receded.
New demographic report on cohort mortality in Sweden
The report Cohort mortality in Sweden – Mortality up to and including 2019 presents changes in mortality rates in a long-term historical perspective, by periods, and with an extra focus on changes by birth cohort. It is based on previous reports on cohort mortality that Statistics Sweden published every ten years.
Mortality is normally calculated based on number of deaths and population size during one year or several years together, which gives a snapshot of the mortality rate. A measure of the number of deaths by birth year at different ages provides information on the average life span of people born in a specific year. The life expectancy of persons born in a specific year can only be determined after around 100 years, when the majority of a birth cohort have died. This means that the cohort of 1920 is the most recent birth cohort for which average life expectancy can be determined with a large degree of certainty.
Definitions and explanations
These statistics are produced using data from Statistics Sweden’s Population Register and historical population statistics from 1861 up to and including 2019.
Average remaining life expectancy is normally referred to as “life expectancy”. This index describes mortality in all ages. Here, average life expectancy is presented for different birth years, which corresponds to the average attained age for women and men born in different years. Mortality is presented in a life table and the average number of years remaining is calculated for all ages. Here, the number of years is calculated from birth.
Publication
Feel free to use the facts from this statistical news but remember to state Source: Statistics Sweden.
