Construction Cost Index for buildings, March 2019
Construction costs rose by 3.9 percent in March on an annual basis
Statistical news from Statistics Sweden 2019-04-15 9.30
The Construction Cost Index for multi-dwelling buildings rose by 0.2 percent between February and March 2019. On an annual basis, construction costs rose by 3.9 percent.
Developments between February and March 2019
The Construction Cost Index for multi-dwelling buildings rose by 0.2 percent between February and March 2019. In the corresponding period in 2018, the Index decreased by 0.1 percent. Contractors’ costs, which account for more than 82 percent of the Construction Cost Index, also increased by 0.2 percent between February and March 2019.
Building material costs increased by 0.3 percent. In the group ‘building materials’, costs increased or remained unchanged for all building materials except electric material, which decreased by 0.1 percent. The largest price increase was the cost of reinforcement steel, which increased by 2.3 percent.
Costs in the group ‘transport, fuel and electricity’ rose by 0.3 percent. This was mainly due to an increase in the cost of diesel oil by 1.1 percent. Contractors’ other costs rose by 0.3 percent, while machinery costs, and wages and salaries remained unchanged.
Over the past month, investor costs, which consist of interest and credit costs, costs for plans and central administration costs, increased by 0.3 percent.
Developments between March 2018 and March 2019
The Construction Cost Index for multi-dwelling buildings increased by 3.9 percent between March 2018 and March 2019. Contractors’ costs rose by 3.4 percent. This increase in contractors’ costs led to an increase of 2.8 percentage points for the total index in the same period.
The group ‘transport, fuel and electricity’ increased the most, by 8.0 percent, among contractors’ costs. Within that group, the cost of electricity, diesel oil and transport increased by 20.6 percent in total, by 11.1 percent and 4.2 percent respectively.
Building material costs increased by 4.2 percent. Material for painting and reinforcement steel rose by 7.5 percent respectively. Wood products rose by 7.0 percent and iron and steel by 6.2 percent, while other building materials and white goods increased by 5.1 and 4.6 percent respectively. Costs in other building material groups also rose, but not to the same extent. Contractors’ other costs, machinery costs, wages, and salaries rose by between 1.9 percent and 2.8 percent.
Investor costs increased by 6.2 percent on an annual basis. This increase was mainly due to higher interest expenses.
Investor costs increased by 5.5 percent on an annual basis. This increase was mainly due to higher interest expenses.
Construction Cost Index for multi-dwelling buildings, excl. wage drift and value-added tax
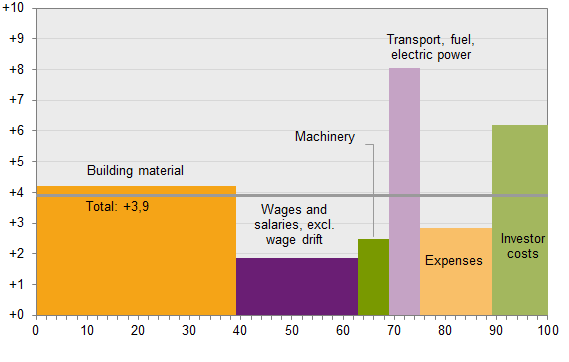
The width of the bars represents the production factor’s weight share in percent in the calculation of the Construction Cost Index for multi-dwelling buildings. The height of the bars represents the average price development of each production factor.
| Goods | Change in percent | ||
|---|---|---|---|
| March 2019– February 2019 | March 2019– March 2018 | ||
|
Material for painting
|
+ 0.0 | + 7.5 | |
|
Reinforcement steel
|
+ 2.3 | + 7.5 | |
|
Wood products
|
-0.0 | + 7.0 | |
|
Iron and steel*
|
+ 1.1 | + 6.2 | |
|
Other building materials**
|
+ 1.1 | + 5.1 | |
|
White goods
|
+ 0.2 | + 4.6 | |
|
Concrete products
|
+ 0.2 | + 3.8 | |
|
Plumbing material
|
+ 0.0 | + 3.8 | |
|
Woodwork
|
+ 0.0 | + 3.5 | |
|
Electric material
|
-0.1 | + 3.0 | |
|
Floor material
|
+ 0.1 | + 2.3 | |
|
Total building materials
|
+ 0.3 | + 4.2 | |
* Includes reinforcement steel. ** Includes materials for thermal insulation, garbage equipment, gypsum and wood-based boards.
Construction Cost Index for multi-dwelling buildings, excl. wage drift and value-added tax
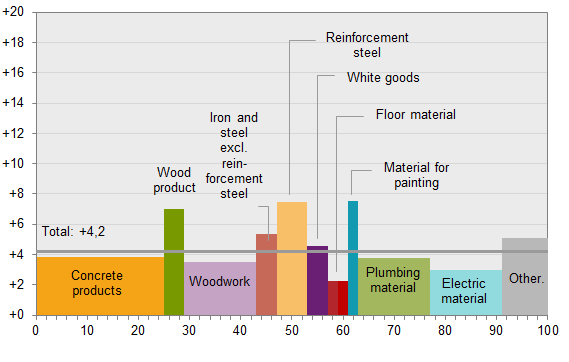
The width of the bars represents the construction material group’s weight share in percent of all construction material in the calculation of the Construction Cost Index for multi-dwelling buildings. The height of the bars represents the average price development for each product category.
Next publishing will be
2019-05-15 at 9:30.
Statistical Database
More information is available in the Statistical Database
Feel free to use the facts from this statistical news but remember to state Source: Statistics Sweden.