Consumer price index for January 2020
Inflation rate according to CPIF was 1.2 percent in January
Statistical news from Statistics Sweden 2020-02-19 9.30
The inflation rate according to the CPIF (Consumer Price Index with fixed interest rate) was 1.2 percent in January 2020, down from 1.7 percent in December 2019. The change on a monthly basis between December and January was -1.5 percent.
In brief
| Index Numbers | Monthly changes, percent | Annual changes, percent | |
|---|---|---|---|
| CPI (1980=100) | 332.82 | ‑1.4 | 1.3 |
| CPIF (1987=100) | 217.68 | ‑1.5 | 1.2 |
| CPIF-XE (1987=100) | 204.94 | ‑1.4 | 1.6 |
• The basket effect affected the monthly rate in January by -0.4 percentage points and the yearly rate by -0.1 percentage points.
• Lower electricity prices affected the monthly rate in January by -0.3 percentage points and the yearly rate by -0.6 percentage points.
• Reduced prices on travel and clothing were seasonally normal.
Clothing, electricity and the basket effect affected the CPIF in January
The CPIF fell by 1.5 percent between December and January. In the corresponding period a year ago, the CPIF fell by 1.0 percent. Lower prices for clothing and shoes, electricity, and travel services were the main contributors to the change on a monthly basis in January 2020. Prices for clothing, shoes, package holidays and international flights usually decrease in January following higher prices during the Christmas holidays.
This decline in prices was offset by higher prices on rent for housing.
The composition of the consumer price inflation basket changes every year. The contents of the consumer price inflation basket of goods and services and their associate weights are updated annually. The ‘basket effect’ refers to the combined effect of the updated consumer price inflation basket and associated weights.
In January 2020, the basket effect contributed -0.4 percentage points to the monthly change in the CPIF and -0.1 percentage points to the yearly rate. Any changes in methods in the CPIF are also introduced in January. For further information on changes introduced ahead of 2020, follow the link under “What’s new in 2020?”.
The table below shows changes on a monthly basis and effects on the CPIF based on the goods and services that had the largest effect on the CPIF in January 2020. The results are reported per COICOP group; COICOP refers to the United Nations classification of household consumption expenditure.
| Namn (Coicop) | Monthly changes, percent | Monthly effect on the CPIF, percentage points |
|---|---|---|
| Food (01.1) | ‑0.6 | ‑0.1 |
| Clothing and footwear (03) | ‑12.2 | ‑0.6 |
| Electricity (04.5.1) | ‑6.1 | ‑0.3 |
| Rented and housing co-operative dwellings: rent incl.heating (04.S) |
0.5 | 0.1 |
| Furniture (05.1) | ‑3.3 | ‑0.1 |
| Transport services (07.3) | ‑7.8 | ‑0.3 |
| Telephone equipment(08.2) | ‑2.4 | ‑0.1 |
| Package holidays (09.6) | ‑17.6 | ‑0.2 |
| Accommodation services (11.2) | ‑7.8 | ‑0.1 |

Seasonal patterns and temporary price changes
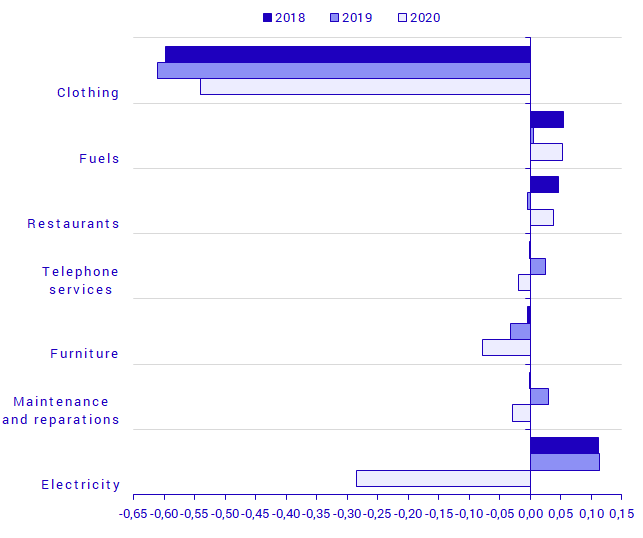
Price changes for goods and services may be seasonal or temporary. The figure above shows effects on a monthly basis for the goods and services that differ most compared with the corresponding month a year ago. Electricity prices increased in January 2019, but they decreased in January 2020.
Fuel prices remained stable in January 2019, but increased in January 2020. Clothing prices fell slightly more in January than a year earlier, but a lower weight for clothing in 2020 offset the effect of lower prices on the inflation rate.
Inflation rate most affected by electricity and transport
The inflation rate according to the CPIF, that is, the change in the CPIF over the past 12-month period, was 1.2 percent in January 2020. This is a decrease compared with 1.7 percent in December.
The inflation rate in January 2020 was mainly affected by higher prices on transport, which includes fuel, food, restaurants and rent for housing. This increase was offset by lower prices for electricity and telecommunications equipment, mobile phones in particular, which had a downward impact on inflation.
| Namn (Coicop) | Yearly change, percent | Yearly change effect, percentage points |
|---|---|---|
| Food (01.1) | 2.3 | 0.3 |
| Electricity (04.5.1) | ‑11.4 | ‑0.6 |
| Rented and housing co-operative dwellings: rent incl.heating (04.S) |
1.5 | 0.2 |
| Imputed rent for owner occupiers (04.x) |
2.4 | 0.1 |
| Imputed rent for tenant-owned apartement (04.y) |
1.9 | 0.1 |
| Transport (07) | 5.0 | 0.6 |
| Fuels (07.2.2) | 9.7 | 0.2 |
| Telephone equipment (08.2) |
‑14.2 | ‑0.2 |
| Restaurants | 3.6 | 0.3 |
| Miscellaneous goods and services(12) |
2.2 | 0.2 |
What’s new in 2020?
Some changes to the production of the Consumer Price Index are being introduced as from 2020.
Changes in the calculation of the CPI from the year 2020 (pdf)
Definitions and explanations
The CPIF shows the same price trend as the CPI, but without the direct effects of a changed monetary policy. The CPIF is the Riksbank’s target variable for the inflation target.
The CPIF excluding energy (CPIF-XE) and the CPIF with constant tax (CPIF-KS) are two other measures of inflation produced by Statistics Sweden on behalf of the Riksbank. In the CPIF-XE, energy products are excluded from the CPIF, while in the CPIF-KS the taxes and subsidies associated with the products in the CPIF are kept constant.
The HICP (Harmonised Index of Consumer Prices) is produced by all EU Member States. This measure has a somewhat smaller coverage than the CPI and the CPIF, mainly due to the fact that parts of households’ housing costs are omitted.
Next publishing will be
2020-03-12 at 09:30.
Statistical Database
More information is available in the Statistical Database
Feel free to use the facts from this statistical news but remember to state Source: Statistics Sweden.
