Purchasing Power Parities (PPPs), 2011–2013:
Swedish households’ consumption 15 percent above EU average
Statistical news from Statistics Sweden 2014-12-15 9.30
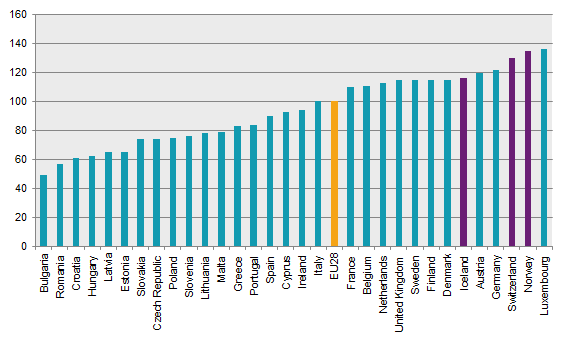
Swedish households’ Actual Individual Consumption per capita is 15 percent above average for the 28 EU countries in 2013. Sweden ranks seventh in Europe, sharing the place with Denmark, Finland and the United Kingdom.
Actual Individual Consumption (AIC) per capita is an indicator describing households’ material welfare in a country. The dispersion in AIC per capita between the 28 EU countries and Norway, Iceland and Switzerland, ranges from 36 percent above the EU28 average to 51 percent below average. Luxembourg tops the list with 36 percent above average, followed by Norway and Switzerland.

Source: Eurostat and Statistics Sweden Note: Norway, Iceland and Switzerland are not EU-members and are therefore not included in the EU28 average. Sorted firstly by AIC in 2013 and secondly in alphabetical order in case of same values.
| AIC per capita | GDP per capita | ||||||
|---|---|---|---|---|---|---|---|
| 2011 | 2012 | 2013 | 2011 | 2012 | 2013 | ||
|
Luxembourg
|
138 | 139 | 136 | 265 | 264 | 257 | |
|
Norway
|
132 | 134 | 135 | 182 | 190 | 186 | |
|
Switzerland
|
126 | 129 | 130 | 159 | 162 | 163 | |
|
Germany
|
121 | 122 | 122 | 122 | 123 | 122 | |
|
Austria
|
120 | 120 | 120 | 128 | 129 | 128 | |
|
Iceland
|
113 | 115 | 116 | 115 | 116 | 119 | |
|
Denmark
|
114 | 115 | 115 | 126 | 125 | 124 | |
|
Finland
|
113 | 115 | 115 | 117 | 115 | 113 | |
|
Sweden
|
114 | 115 | 115 | 106 | 107 | 109 | |
|
United Kingdom
|
114 | 114 | 115 | 127 | 126 | 127 | |
|
Netherlands
|
118 | 116 | 113 | 135 | 132 | 131 | |
|
Belgium
|
111 | 112 | 111 | 120 | 120 | 119 | |
|
France
|
111 | 110 | 110 | 108 | 107 | 107 | |
|
Italy
|
106 | 102 | 100 | 103 | 101 | 99 | |
|
EU28
|
100 | 100 | 100 | 100 | 100 | 100 | |
|
Ireland
|
97 | 94 | 94 | 130 | 130 | 130 | |
|
Cyprus
|
98 | 98 | 93 | 96 | 93 | 89 | |
|
Spain
|
91 | 90 | 90 | 95 | 94 | 94 | |
|
Portugal
|
83 | 80 | 84 | 78 | 76 | 79 | |
|
Greece
|
89 | 84 | 83 | 77 | 74 | 73 | |
|
Malta
|
80 | 80 | 79 | 84 | 84 | 86 | |
|
Lithuania
|
70 | 73 | 78 | 65 | 69 | 73 | |
|
Slovenia
|
79 | 78 | 76 | 83 | 82 | 82 | |
|
Poland
|
70 | 73 | 75 | 64 | 66 | 67 | |
|
Czech Republic
|
72 | 73 | 74 | 73 | 74 | 75 | |
|
Slovakia
|
73 | 73 | 74 | 83 | 82 | 82 | |
|
Estonia
|
59 | 63 | 65 | 68 | 71 | 73 | |
|
Latvia
|
57 | 60 | 65 | 57 | 60 | 64 | |
|
Hungary
|
62 | 62 | 62 | 65 | 65 | 66 | |
|
Croatia
|
59 | 60 | 61 | 60 | 61 | 61 | |
|
Romania
|
53 | 55 | 57 | 51 | 53 | 55 | |
|
Bulgaria
|
47 | 50 | 49 | 44 | 45 | 45 | |
GDP per capita is an indicator mainly of the economic activity in a particular country. Sweden’s GDP per capita is 27 percent above EU average in 2013. Luxembourg has by far the highest GDP per capita, at 157 percent above EU average. The relatively high figure is partly explained by the fact that a large number of foreign residents are employed in the country and are thus contributing to its GDP, while they are not included in the resident population. Bulgaria and Romania have a GDP per capita around 50 percent below EU average.
Definitions and explanations
Purchasing Power Parities (PPPs) aim to measure the price differences between countries on comparable goods and services. The survey should represent the entire country’s Gross Domestic Product (GDP) and is mainly used for comparisons of GDP volumes across countries.
GDP is first calculated in national currency, and then converted with an artificial currency called Purchasing Power Standards (PPS), instead of using the nominal market exchange rates. PPS, which is based on PPPs, take into consideration different price levels between countries, and allows meaningful volume comparisons of economic indicators across countries.
Next publishing will be
2015-12-15 at 09:30.
Statistical Database
More information is available in the Statistical Database
Feel free to use the facts from this statistical news but remember to state Source: Statistics Sweden.
