Purchasing Power Parities 2016-2018
Swedish households’ Actual Individual Consumption 8 percent above EU average
Statistical news from Statistics Sweden 2019-12-19 9.30
Swedish households’ Actual Individual Consumption (AIC) per capita was 8 percent above the average for the 28 EU countries in 2018. Sweden ranks twelfth in Europe.
Actual Individual Consumption (AIC) refers to all goods and services that are actually consumed by individual households, irrespective of whether these goods and services are purchased and provided by households, by the State or by non-profit organisations. In international comparisons, AIC is often preferred as an indicator of households’ material welfare.
AIC per capita varied among the 28 EU Member States, Norway, Iceland, and Switzerland, from 34 percent above the EU 28 average to 44 percent below the EU 28 average. Luxemburg tops the list with 34 percent above, followed by Norway, which recorded 26 percent above, and Switzerland which recorded 24 percent above the EU average. However, it should be noted that Norway, Switzerland and Iceland are not included in the EU 28 average.
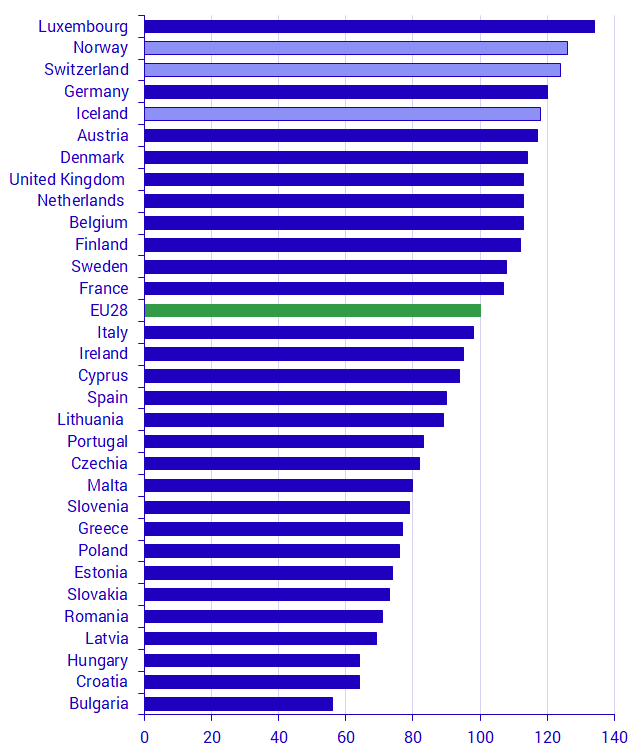
Source: Eurostat and SCB
GDP per capita is mainly an indicator of economic activity in a particular country.
In 2018, Sweden’s GDP per capita was 20 percent above the EU 28 average. Luxembourg had by far the highest GDP per capita, at 161 percent above the EU average. This high figure is due, in part, to the large share of foreign workers in the country, who contribute to GDP, but are not included in the population statistics. The lowest figure recorded in this comparison was 49 percent below the EU average, in Bulgaria.
| AIC volume index per capita, EU28=100 | GDP volume index per capita, EU28=100 | ||||||
|---|---|---|---|---|---|---|---|
| 2016 | 2017 | 2018 | 2016 | 2017 | 2018 | ||
| Luxembourg | 135 | 133 | 134 | 269 | 261 | 261 | |
| Norway | 127 | 126 | 126 | 144 | 146 | 151 | |
| Switzerland | 127 | 124 | 124 | 160 | 155 | 155 | |
| Germany | 121 | 121 | 120 | 123 | 123 | 122 | |
| Iceland | 114 | 116 | 118 | 129 | 129 | 130 | |
| Austria | 119 | 118 | 117 | 128 | 127 | 127 | |
| Denmark | 113 | 114 | 114 | 127 | 127 | 128 | |
| Belgium | 114 | 113 | 113 | 119 | 118 | 117 | |
| Netherlands | 111 | 112 | 113 | 127 | 128 | 129 | |
| United Kingdom | 115 | 114 | 113 | 108 | 106 | 105 | |
| Finland | 112 | 111 | 112 | 110 | 110 | 111 | |
| Sweden | 112 | 111 | 108 | 123 | 122 | 120 | |
| France | 110 | 108 | 107 | 105 | 103 | 104 | |
| EU-28 | 100 | 100 | 100 | 100 | 100 | 100 | |
| Italy | 98 | 98 | 98 | 97 | 97 | 96 | |
| Ireland | 95 | 94 | 95 | 176 | 181 | 189 | |
| Cyprus | 92 | 93 | 94 | 87 | 88 | 89 | |
| Spain | 90 | 91 | 90 | 91 | 92 | 91 | |
| Lithuania | 85 | 87 | 89 | 75 | 78 | 80 | |
| Portugal | 82 | 81 | 83 | 77 | 77 | 77 | |
| Czech Republic | 79 | 81 | 82 | 87 | 89 | 91 | |
| Malta | 78 | 78 | 80 | 95 | 97 | 98 | |
| Slovenia | 77 | 78 | 79 | 83 | 85 | 87 | |
| Greece | 77 | 76 | 77 | 68 | 67 | 68 | |
| Poland | 74 | 75 | 76 | 68 | 69 | 70 | |
| Estonia | 72 | 72 | 74 | 76 | 78 | 82 | |
| Slovakia | 68 | 69 | 73 | 72 | 72 | 73 | |
| Romania | 65 | 69 | 71 | 59 | 63 | 65 | |
| Latvia | 66 | 67 | 69 | 64 | 66 | 69 | |
| Croatia | 61 | 62 | 64 | 60 | 61 | 63 | |
| Hungary | 62 | 63 | 64 | 68 | 68 | 71 | |
| Bulgaria | 54 | 54 | 56 | 49 | 50 | 51 | |
Source: Eurostat and SCB Source: Eurostat and SCB. Note: Norway, Iceland and Switzerland are not EU-members and are therefore not included in the EU28 average. Sorted firstly by AIC in 2018 and secondly in alphabetical order.
Definitions and explanations
Purchasing power parities (PPP) are currency conversion rates that are applied in order to convert economic indicators from national currency to artificial common currency, called Purchasing Power Standard (PPS), which equalises the purchasing power of different national currencies and enables meaningful volume comparison between countries.
PPP is the ratio between the amount in the countries’ domestic currency that is needed to purchase the same basket of goods and services.
GDP is first calculated in the domestic currency and later converted with an artificial currency, Purchasing Power Standard (PPS). GDP per capita adjusted with purchasing power reflects the difference in volume in real terms between countries.
Eurostat’s publishing of Purchasing Power Parities
Consumption per capita in purchasing power standards in 2018
Next publishing will be
The next item of statistical news will be published on 22 December 2020 at 9:30.
Statistical Database
More information is available in the Statistical Database
Feel free to use the facts from this statistical news but remember to state Source: Statistics Sweden.