Monthly indicator of household consumption, July 2019
Household consumption increased in July
Statistical news from Statistics Sweden 2019-09-10 9.30
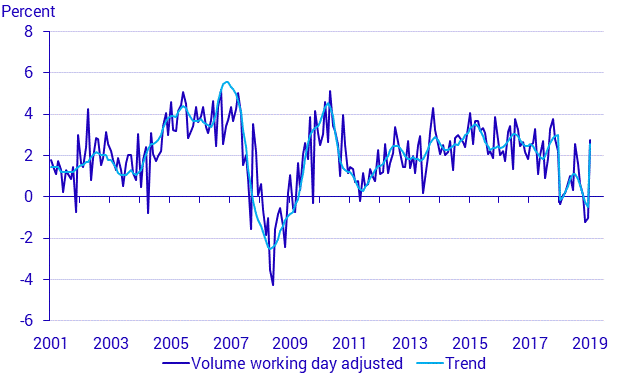
Household consumption increased by 2.8 percent in July, compared with July 2018 measured in fixed prices and working day adjusted figures. In the last three-month period, consumption increased by 0.1 percent in fixed prices and working day adjusted figures, compared with the same period last year. Household consumption increased by 0.8 percent in seasonally adjusted figures compared with June.
The largest weighted positive contributions came from the sector Transport and retail sales and service of motor vehicles, which increased by 6.5 percent in fixed prices compared with July last year.
Restaurants, cafes, hotels and other accommodation services had the largest weighted negative contribution to total consumption and decreased by 0.5 percent in fixed prices compared with July last year. Prices increased by 1.7 percent according to the consumption deflator.

An unusually low consumption value in July 2018 led to a level shift in the trend series that is reflected by the low growth rate in July 2018 and a higher growth rate in July 2019.
Activity |
Current prices |
Volume |
Volume working day adjusted |
Weight | |||
|---|---|---|---|---|---|---|---|
| July | 2019* | July | 2019* | July | 2019* | ||
Household consumption (excl. foreign posts) |
5.6 | 2.6 | 3.8 | 0.7 | 2.8 | 0.7 | 0.88 |
Retail trade, mostly food and beverages |
5.1 | 3.6 | 1.8 | 1.1 | 0.8 | 1.2 | 0.18 |
Retail trade, clothing and footwear |
6.5 | 1.4 | 6.7 | 2.4 | 5.0 | 2.6 | 0.03 |
Housing, electricity, gas and heating |
2.1 | 2.9 | 0.4 | 0.8 | 0.2 | 0.9 | 0.27 |
Furniture, furnishings, household equipment and consumables |
16.2 | 6.1 | 14.1 | 4.5 | 13.7 | 4.4 | 0.04 |
Transport and retail sales and service of motor vehicles |
10.0 | ‑0.8 | 6.5 | ‑4.3 | 4.2 | ‑4.2 | 0.14 |
Post and telecommunications |
2.7 | 1.3 | 7.0 | 4.8 | 6.7 | 4.8 | 0.03 |
Recreation and culture, goods and services |
8.6 | 3.0 | 9.4 | 2.9 | 7.9 | 3.0 | 0.09 |
Restaurants, cafes, hotels and other accommodation services |
2.7 | 2.7 | ‑0.5 | 0.2 | ‑0.6 | 0.1 | 0.06 |
Other goods and services |
7.9 | 8.0 | 5.8 | 4.9 | 3.3 | 4.8 | 0.02 |
All figures compared to the same period in the previous year. *The period from January to the current month compared to the same period in the previous year.
Next publishing will be
2019-10-10 at 9:30.
Statistical Database
More information is available in the Statistical Database
Feel free to use the facts from this statistical news but remember to state Source: Statistics Sweden.
