Exports and imports of goods, quarter 4 2022/January-December 2022, in current prices and in constant prices
Stronger fourth than third quarter for trade in goods
Statistical news from Statistics Sweden 2023-02-28 8.00
In the fourth quarter 2022, exports of goods increased by 19 percent in value and by 1 percent in volume compared with the same period a year ago. At the same time, imports of goods rose by 22 percent in value while they fell by 1 percent in volume.
- Mineral fuels/electric current, chemicals/rubber products and machinery/transport equipment accounted for the largest increase from the United States in 2022, says Ari Mansikkaviita, statistician at Statistics Sweden.
Summary
- In the fourth quarter of 2022, Swedish exports of goods increased by 19 percent in value (in current prices), and in terms of volume (in constant prices) exports of goods increased by 1 percent, compared with the same period a year ago. Imports of goods increased by 22 percent in value, while in terms of volume they decreased by 1 percent.
- Compared with the previous quarter, Swedish exports of goods increased by 10 percent in both value and in volume. Imports of goods rose by 9 percent in value and by 8 percent in volume.
- In the period January–December 2022, the value of Swedish exports of goods amounted to SEK 1 999 billion, an increase of 23 percent compared with the same period a year ago. At the same time, the value of imports of goods increased by 27 percent and amounted to SEK 2 045 billion.
- In the period January–December 2022, both exports and imports of goods increased by 3 percent in volume.
- Net trade shows a deficit of SEK 46 billion in the period January–December 2022. In the same period in 2021, there was a net trade surplus of SEK 20 billion.
Detailed information about the fourth quarter 2022 (in current prices and in constant prices)
Exports of pharmaceutical products increased by 44 percent in value and by 39 percent in volume
In the fourth quarter of 2022, Sweden’s exports of goods increased by 19 percent in value and by 1 percent in volume, compared with the corresponding period a year ago.
Exports of machinery and transport equipment increased by 17 percent in value while they remained the same in volume. Within this product area, export of passenger cars increased by 25 percent in value and by 7 percent in volume. Exports of mineral fuels and electric current rose by 46 percent in value while they fell by 1 percent in volume. The large difference between value and volume development is due to higher prices for oil products. Minerals increased by 4 percent in value while they decreased by 6 percent in volume. Exports of chemicals and rubber products rose by 29 percent in value and by 16 percent in volume. Within this product area, exports of pharmaceutical products increased by 44 percent in value and by 39 percent in volume. Exports of wood and paper products rose by 13 percent in value and by 6 percent in volume. Within this product area, exports of wood decreased by 6 percent in value while they increased by 48 percent in volume. Within the other products area, exports of food/beverages/tobacco increased by 24 percent in value while they remained the same in volume.
Imports of passenger cars increased by 32 percent in value and by 24 percent in volume
In the fourth quarter of 2022, Sweden’s imports of goods increased by 22 percent in value while they fell by 1 percent in volume compared with the corresponding period a year ago.
Imports of machinery and transport equipment increased by 16 percent in value and by 1 percent in volume. Within this product area, imports of passenger cars increased by 32 percent in value and by 24 percent in volume. Imports of mineral fuels and electric current rose by 64 percent in value and by 7 percent in volume. The large difference between the value and volume development is due to higher crude oil prices. Imports of chemicals and rubber products rose by 28 percent in value and by 4 percent in volume. Imports of wood and paper products increased by 26 percent in value while they fell by 3 percent in volume. Imports of minerals rose by 5 percent in value while they decreased by 9 percent in volume. Within the other products area, imports of food/beverages/tobacco increased by 24 percent in value while they remained the same in volume.
Value and volume trends
The value index and the volume index describe nominal and real value trends over time. The real value trends describe trends in which price changes have been removed. The indices are chain indices with base year 2015=100.
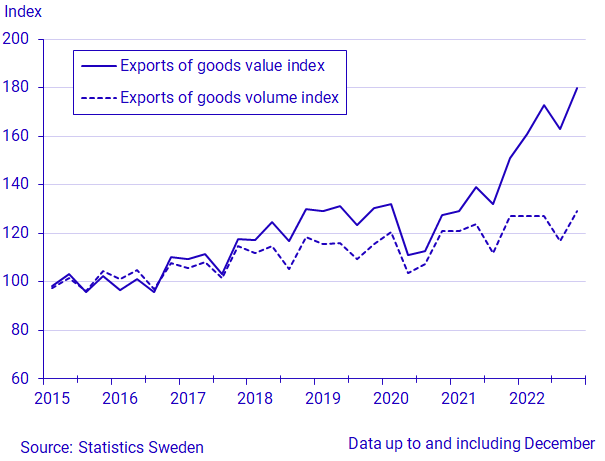
The value index and the volume index for exports increased in the fourth quarter compared to the third quarter. The positive value trend which was broken in the third quarter is now on its way up again. Both the value index and the volume index are higher the fourth quarter compared to the same period last year. Export prices increased for all product groups except for exports of wood.
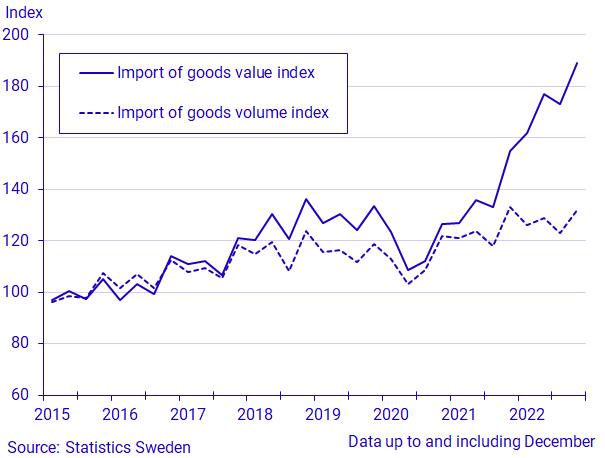
The value index for imports of goods increased in the fourth quarter and is higher compared to the same period last year. The volume index increased in the fourth quarter compared to the third quarter but is lower compared to the fourth quarter of 2021. Import prices increased compared to the same period a year ago.
| Exports | Imports | ||||||||
|---|---|---|---|---|---|---|---|---|---|
| Value (current prices) | Value (current prices) | ||||||||
| Region | January-December | Share in % | Change in % | January-December | Share in % | Change in % | |||
| 2022 | 2021 | 2022 | 2022/2021 | 2022 | 2021 | 2022 | 2022/2021 | ||
| Total | 1 998 500 | 1 626 423 | 100.0 | 23 | 2 044 528 | 1 606 594 | 100.0 | 27 | |
| Europe | 1 469 393 | 1 209 519 | 73.5 | 21 | 1 677 085 | 1 346 820 | 82.0 | 25 | |
| EU27_2020 | 1 079 140 | 873 119 | 54.0 | 24 | 1 296 025 | 1 066 661 | 63.4 | 22 | |
| EMU-19 | 802 407 | 649 598 | 40.2 | 24 | 1 016 668 | 827 480 | 49.7 | 23 | |
| Other European countries | 390 252 | 336 400 | 19.5 | 16 | 381 060 | 280 159 | 18.6 | 36 | |
| Africa | 35 784 | 27 610 | 1.8 | 30 | 23 381 | 10 969 | 1.1 | 113 | |
| North Africa | 16 979 | 14 262 | 0.8 | 19 | 5 262 | 4 608 | 0.3 | 14 | |
| West Africa | 4 561 | 3 018 | 0.2 | 51 | 14 519 | 3 773 | 0.7 | 285 | |
| Central, East and Southern Africa | 14 245 | 10 330 | 0.7 | 38 | 3 599 | 2 588 | 0.2 | 39 | |
| America | 244 252 | 177 815 | 12.2 | 37 | 98 596 | 63 550 | 4.8 | 55 | |
| North America | 201 802 | 148 913 | 10.1 | 36 | 80 561 | 51 120 | 3.9 | 58 | |
| Central and South America | 42 450 | 28 902 | 2.1 | 47 | 18 034 | 12 430 | 0.9 | 45 | |
| Asia | 220 223 | 189 286 | 11.0 | 16 | 237 918 | 181 887 | 11.6 | 31 | |
| Middle- and Near East | 35 152 | 29 353 | 1.8 | 20 | 7 609 | 4 111 | 0.4 | 85 | |
| Other countries in Asia | 185 070 | 159 932 | 9.3 | 16 | 230 310 | 177 777 | 11.3 | 30 | |
| Oceania and Antarctica | 20 552 | 16 419 | 1.0 | 25 | 7 510 | 3 014 | 0.4 | 149 | |
| Exports | ||||||||
|---|---|---|---|---|---|---|---|---|
| Value (current prices) | Value (current prices) | Volume (value in constant prices) | Value (current prices) | Volume (value in constant prices) | ||||
| Share in % | Change in % | Change in % | Change in % | Change in % | ||||
| Commodity group according to SITC | January-December 2022 | January-December 2021 | January-December 2022 | Q1-4 2022/Q1-4 2021 | Q1-4 2022/Q1-4 2021 | Q4 2022/Q4 2021 | Q42022/Q4 2021 | |
| Total | 1 998 500 | 1 626 423 | 100.0 | 23 | 3 | 19 | 1 | |
| Wood and paper products | 198 905 | 166 744 | 10.0 | 19 | 3 | 13 | 6 | |
| Wood | 53 794 | 49 454 | 2.7 | 9 | 19 | ‑6 | 48 | |
| Pulp and waste paper | 32 394 | 27 303 | 1.6 | 19 | ‑8 | 12 | ‑16 | |
| Paper, paper products | 103 810 | 82 208 | 5.2 | 26 | ‑3 | 26 | ‑7 | |
| Minerals | 222 924 | 186 541 | 11.2 | 20 | ‑1 | 4 | ‑6 | |
| Iron ore and concentrates | 37 512 | 40 540 | 1.9 | ‑7 | ‑4 | ‑9 | ‑9 | |
| Iron and steel | 93 080 | 71 983 | 4.7 | 29 | ‑3 | 10 | ‑3 | |
| Non-ferrous metals | 48 309 | 37 446 | 2.4 | 29 | 8 | ‑3 | ‑11 | |
| Chemicals, rubber products | 297 852 | 232 080 | 14.9 | 28 | 15 | 29 | 16 | |
| Organic/inorganic chemicals | 29 992 | 23 774 | 1.5 | 26 | ‑6 | 13 | ‑12 | |
| Pharmaceutical products | 139 381 | 100 435 | 7.0 | 39 | 34 | 44 | 39 | |
| Plastics | 51 695 | 43 542 | 2.6 | 19 | ‑1 | 12 | ‑1 | |
| Mineral fuels, electric current | 217 555 | 119 619 | 10.9 | 82 | 4 | 46 | ‑1 | |
| Petroleum products | 160 666 | 91 154 | 8.0 | 76 | 2 | 45 | ‑5 | |
| Machinery, transport equipment | 794 259 | 695 463 | 39.7 | 14 | 1 | 17 | 0 | |
| Manufactures of metals | 48 975 | 43 075 | 2.5 | 14 | ‑2 | 9 | ‑4 | |
| Industrial machinery | 255 099 | 225 002 | 12.8 | 13 | 3 | 18 | 3 | |
| Electronics, telecommunication | 193 154 | 170 138 | 9.7 | 14 | ‑2 | 13 | ‑7 | |
| Road vehicles | 243 561 | 210 867 | 12.2 | 16 | 1 | 20 | 3 | |
| Passenger cars | 123 760 | 108 679 | 6.2 | 14 | ‑2 | 25 | 7 | |
| Lorries, trucks[1] | 40 569 | 31 814 | 2.0 | 28 | 13 | 25 | 5 | |
| Parts, accessories | 60 660 | 54 476 | 3.0 | 11 | 0 | 8 | ‑6 | |
| Other transport equipment | 10 887 | 8 351 | 0.5 | 30 | 19 | 0 | ‑12 | |
| Instruments, photo/optical products | 42 584 | 38 029 | 2.1 | 12 | 0 | 17 | 3 | |
| Other products | 267 005 | 225 976 | 13.4 | 18 | 1 | 16 | ‑3 | |
| Food, beverages, tobacco | 129 733 | 103 502 | 6.5 | 25 | 4 | 24 | 0 | |
| Textiles, clothing, footwear | 54 118 | 46 633 | 2.7 | 16 | 6 | 15 | 3 | |
| Furniture | 23 572 | 21 195 | 1.2 | 11 | ‑7 | 5 | ‑14 | |
| Imports | ||||||||
|---|---|---|---|---|---|---|---|---|
| Value (current prices) | Value (current prices) | Volume (value in constant prices) | Value (current prices) | Volume (value in constant prices) | ||||
| Share in % | Change in % | Change in % | Change in % | Change in % | ||||
| Commodity group according to SITC | January-December 2022 | January-December 2021 | January-December 2022 | Q1-4 2022/Q1-4 2021 | Q1-4 2022/Q1-4 2021 | Q4 2022/Q4 2021 | Q4 2022/Q4 2021 | |
| Total | 2 044 528 | 1 606 594 | 100.0 | 27 | 3 | 22 | ‑1 | |
| Wood and paper products | 56 488 | 42 447 | 2.8 | 33 | 4 | 26 | ‑3 | |
| Minerals | 172 637 | 136 022 | 8.4 | 27 | ‑3 | 5 | ‑9 | |
| Iron and steel | 76 089 | 59 259 | 3.7 | 28 | ‑5 | ‑9 | ‑17 | |
| Non-ferrous metals | 38 512 | 29 151 | 1.9 | 32 | ‑2 | 3 | ‑13 | |
| Metalliferrous ores, metal scrap | 25 919 | 21 189 | 1.3 | 22 | 7 | 35 | 32 | |
| Chemicals, rubber products | 265 379 | 204 660 | 13.0 | 30 | 3 | 28 | 4 | |
| Organic/inorganic chemicals | 60 933 | 39 767 | 3.0 | 53 | ‑1 | 50 | 6 | |
| Pharmaceutical products | 66 106 | 52 668 | 3.2 | 26 | 12 | 41 | 23 | |
| Plastics | 49 755 | 41 266 | 2.4 | 21 | ‑4 | 1 | ‑15 | |
| Crude rubber, rubber products | 21 583 | 17 876 | 1.1 | 21 | 5 | 18 | ‑2 | |
| Mineral fuels, electric current | 287 477 | 156 176 | 14.1 | 84 | ‑1 | 64 | 7 | |
| Crude petroleum oils | 151 273 | 81 238 | 7.4 | 86 | 5 | 66 | 11 | |
| Petroleum products | 96 673 | 52 583 | 4.7 | 84 | ‑2 | 86 | 11 | |
| Machinery, transport equipment | 823 446 | 707 037 | 40.3 | 16 | 4 | 16 | 1 | |
| Manufactures of metals | 68 553 | 54 370 | 3.4 | 26 | 4 | 13 | ‑8 | |
| Industrial machinery | 195 158 | 167 908 | 9.5 | 16 | 5 | 17 | 2 | |
| Electronics, telecommunication | 302 374 | 262 336 | 14.8 | 15 | 2 | 13 | ‑4 | |
| Road vehicles | 197 404 | 169 701 | 9.7 | 16 | 7 | 25 | 13 | |
| Passenger cars | 98 320 | 86 844 | 4.8 | 13 | 8 | 32 | 24 | |
| Parts and accessories | 60 567 | 53 702 | 3.0 | 13 | ‑1 | 18 | ‑3 | |
| Other transport equipment | 12 470 | 12 040 | 0.6 | 4 | ‑9 | ‑33 | ‑43 | |
| Instruments, photo/optical equip | 47 488 | 40 682 | 2.3 | 17 | 9 | 17 | 7 | |
| Other products | 439 101 | 360 252 | 21.5 | 22 | 3 | 16 | ‑4 | |
| Food, beverages, tobacco | 208 872 | 164 766 | 10.2 | 27 | 3 | 24 | 0 | |
| Textiles, clothing, footwear | 104 974 | 87 689 | 5.1 | 20 | 4 | 18 | 0 | |
| Furniture | 31 572 | 28 278 | 1.5 | 12 | ‑4 | ‑2 | ‑20 | |
Detailed information about January–December 2022 (current prices)
Imports of goods from the United States increased by 64 percent
Sweden’s exports of goods to EU27 increased by 24 percent, and imports from there increased by 22 percent compared with the same period a year ago. Exports to the euro countries rose by 24 percent, and imports from there increased by 23 percent. Among the EU countries, exports to both Germany and Denmark increased by 19 percent and to Finland by 27 percent. Imports from Germany increased by 15 percent, from Denmark by 18 percent and from Finland by 30 percent. In the period, exports of mineral fuels/electric current accounted for the largest increase to Finland. At the same time, mineral fuels/electric current and machinery/transport equipment accounted for the largest import increase from Finland.
Exports to other European countries increased by 16 percent, and imports from there increased by 36 percent. Exports to the United Kingdom rose by 21 percent, and imports from there by 51 percent. In the period, exports of petroleum products and machinery/transport equipment accounted for the largest increase to the United Kingdom. Imports of crude petroleum oils accounted for the largest increase from the United Kingdom. Exports to Norway increased by 23 percent, and imports from there increased by 47 percent. In the period, exports of mineral fuels/electric current and machinery/transport equipment accounted for the largest increase to Norway. At the same time, imports of crude petroleum oils and food/beverages/tobacco accounted for the largest increase from Norway. Exports to Russia fell by 54 percent and imports from there by 64 percent. In the period, exports of machinery/transport equipment accounted for the largest decrease to Russia. At the same time, imports of crude petroleum oils and chemicals/rubber products accounted for the largest decrease from Russia.
Exports to Asia rose by 16 percent, and imports from there by 31 percent. Exports to China increased by 5 percent, and imports from there increased by 32 percent. In the period, imports of machinery/transport equipment accounted for the largest increase from China.
Exports to the United States increased by 34 percent and imports from there by 64 percent. In the period, exports of machinery/transport equipment and chemical/rubber products accounted for the largest increase to the United States.
Exports of mineral fuels and electric current increased by 82 percent
Exports of machinery and transport equipment increased by 14 percent. Exports of minerals increased by 20 percent. Within this product area, exports of iron/steel rose by 29 percent, while exports of iron ore fell by 7 percent. Exports of wood and paper products increased by 19 percent, and mineral fuels and electric current increased by 82 percent. Exports of chemicals and rubber products rose by 28 percent. Within the other products area, food/beverages/tobacco increased by 25 percent.
Imports of food/beverages/tobacco increased by 27 percent
Imports of machinery and transport equipment increased by 16 percent. Imports of minerals rose by 27 percent and wood and paper products increased by 33 percent. Imports of chemicals and rubber products rose by 30 percent. Within this product area, imports of organic/inorganic chemicals increased by 53 percent. Imports of mineral fuels and electric current increased by 84 percent. Within the other products area, imports of food/beverages/tobacco increased by 27 percent.
Definitions and explanations
The United Kingdom’s withdrawal from the European Union has led to the replacement of the former EU28 group in the country tables for foreign trade in goods with the EU27_2020 group. This change applies to country tables with data reported as from January 2020. The cutoff point is January 2020, rather than the actual withdrawal month February 2020, since the values in the tables are based on accumulated periods starting from January.
Next publishing will be
2023-03-27 at 08:00.
Statistical Database
More information is available in the Statistical Database
Feel free to use the facts from this statistical news but remember to state Source: Statistics Sweden.