Party Preference Survey in May 2018 – Election today:
Political Party Preference Survey, May 2018
Statistical news from Statistics Sweden 2018-06-05 9.30
Statistics Sweden’s Party Preference Survey shows that if a parliamentary election were to be held in May, the government parties (S and MP) would receive 32.6 percent of the votes. The Alliance parties (C+L+M+KD) would receive 38.6 percent, the Sweden Democrats would receive 18.5 percent, the Left Party would receive 7.4 percent and other parties would receive 2.9 percent of the votes.
A statistically significant total decrease is noted for the government parties compared with the 2014 parliamentary election. The Social Democrats would receive 28.3 (±0.8) percent, while the Green Party would receive 4.3 (±0.4) percent of the votes if an election were to be held in May 2018.
No statistically significant change has been noted for the Alliance parties as a block, compared with the 2014 parliamentary election. In an election in May, the Centre Party would receive 8.7 (±0.5) percent, the Liberal Party would receive 4.4 (±0.4) percent, the Moderate Party would receive 22.6 (±0.8) percent and the Christian Democrats would receive 2.9 (±0.3) percent of the votes.
The Sweden Democrats would receive 18.5 (±0.8) percent, the Left Party would receive 7.4 (±0.5) percent and other parties would receive 2.9 (±0.4) percent of the votes if there were an election in May. The Feminist Initiative Party is largest among other parties.
In May 2018, about 18 percent of the electorate is uncertain.
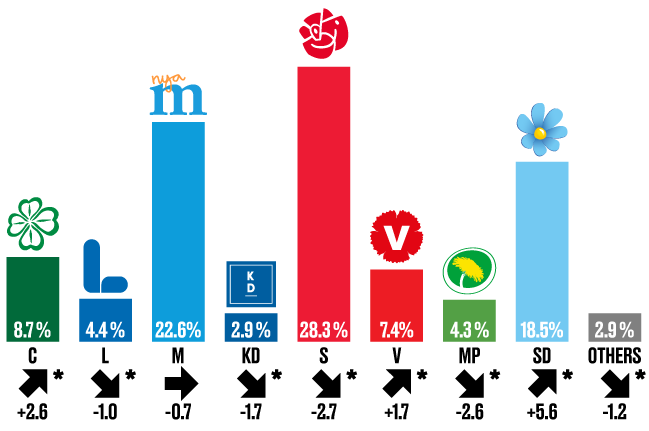
The change is in comparison with the 2014 parliamentary election in percentage points. Statistically significant changes are marked with an asterisk (*).
The table below presents an estimate of the parties in May 2018, November 2017, and the latest election results. The table also shows changes from the November 2017 survey results and the 2014 parliamentary election. Statistically significant changes are marked with an asterisk (*).
Type of question: Which party would you vote for if an election were to be held in the next few days?
| Estimate May 2018 | Estimate November 2017 | ||||||||
|---|---|---|---|---|---|---|---|---|---|
| Party | Percent | Margin of error[1] | Percent | Margin of error[1] | Change since November 2017 | Election 2014 | Change since election 2014 | ||
| C | 8.7 | ±0.5 | 9.5 | ±0.6 | ‑0.8* | 6.1 | 2.6* | ||
| L | 4.4 | ±0.4 | 4.2 | ±0.4 | 0.2 | 5.4 | ‑1.0* | ||
| M | 22.6 | ±0.8 | 22.2 | ±0.8 | 0.4 | 23.3 | ‑0.7 | ||
| KD | 2.9 | ±0.3 | 3.1 | ±0.3 | ‑0.2 | 4.6 | ‑1.7* | ||
| S | 28.3 | ±0.8 | 32.6 | ±0.9 | ‑4.3* | 31.0 | ‑2.7* | ||
| V | 7.4 | ±0.5 | 7.0 | ±0.5 | 0.4 | 5.7 | 1.7* | ||
| MP | 4.3 | ±0.4 | 3.8 | ±0.4 | 0.5* | 6.9 | ‑2.6* | ||
| SD | 18.5 | ±0.8 | 14.8 | ±0.7 | 3.7* | 12.9 | 5.6* | ||
| other | 2.9 | ±0.4 | 2.6 | ±0.4 | 0.3 | 4.1 | ‑1.2* | ||
1) The margin of error applies to estimates of both percentages and changes. Statistically significant changes are marked with an asterisk (*).
Results of the surveys carried out during the current electoral period are available in Statistics Sweden’s Statistical Database.
The political parties in May 2018
The May 2018 estimate and changes for all political parties compared with the November 2017 survey and the 2014 parliamentary election are described below. The flow of voters between the parties is also described below. Only statistically significant changes in the flow of voters are reported.
Centre Party
If an election were held in May 2018, the Centre Party would receive 8.7 ± 0.5 percent of the votes. This is a statistically significant decrease compared with November 2017, while it is a statistically significant increase compared with the 2014 parliamentary election.
In relation to November 2017, the Centre Party has a statistically significant net loss of about 0.3 percent to the Liberal Party.
Compared with the 2014 parliamentary election, statistically significant net gains are noted of about 1.0 percent from the Moderate Party, about 0.7 percent from the Green Party, about 0.6 percent from the Christian Democrats, about 0.4 percent from the Liberal Party, and about 0.2 percent from “Other parties”. At the same time, the Centre Party has a statistically significant net loss of about 0.3 percent to the Sweden Democrats.
Liberal Party
The Liberal Party would receive 4.4 ± 0.4 percent of the votes in an election in May 2018. This is not a statistically significant change compared with November 2017, while it shows a statistically significant decrease in relation to the 2014 parliamentary election.
In relation to November 2017, the Liberal Party has a statistically significant net gain of about 0.3 percent from the Centre Party.
Compared with the 2014 parliamentary election, statistically significant net losses are noted of about 0.4 percent to the Centre Party and about 0.2 percent to “Other parties”.
Moderate Party
If an election were held in May 2018, the Moderate Party would receive 22.6 ± 0.8 percent of the votes. This is not a statistically significant change compared with November 2017 and with the 2014 parliamentary election.
Compared with November 2017, the Moderate Party has a statistically significant net gain of about 0.3 percent from the Green Party. At the same time, the Moderate Party has a statistically significant net loss of about 1.0 percent to the Sweden Democrats.
In relation to the 2014 parliamentary election, the Moderate Party has statistically significant net gains of about 0.7 percent from the Social Democrats and about 0.4 percent from the Christian Democrats. At the same time, the Moderate Party has statistically significant net losses of about 2.2 percent to the Sweden Democrats and about 1.0 percent to the Centre Party.
Christian Democrats
The Christian Democrats would receive 2.9 ± 0.3 percent of the votes in an election in May 2018. This is not a statistically significant change compared with November 2017, while it is a statistically significant decrease in relation to the 2014 parliamentary election.
Compared with the 2014 parliamentary election, statistically significant net losses are noted of about 0.6 percent to the Centre Party, about 0.4 percent to the Moderate Party and about 0.3 percent to the Sweden Democrats.
Social Democrats
The Social Democrats would receive 28.3 ± 0.8 percent of the votes in an election in May 2018. This is a statistically significant decrease, both compared with November 2017 and with the 2014 parliamentary election.
In relation to November 2017, the Social Democrats have statistically significant net losses of about 2.2 percent to the “do not know” group, about 0.4 percent to the Sweden Democrats and about 0.2 percent to “Other parties”.
In relation to the 2014 parliamentary election, a statistically significant net gain of about 0.9 percent from the Green Party was noted. At the same time, compared with the 2014 parliamentary election, the Social Democrats have statistically significant net losses of about 2.5 percent to the Sweden Democrats, about 0.7 percent to the Moderate Party and about 0.6 percent to the Left Party.
Left Party
If an election were held in May 2018, the Left Party would receive 7.4 ± 0.5 percent of the votes. Compared with November 2017, this is not a statistically significant change, while in relation to the 2014 parliamentary election, it is a statistically significant increase.
In relation to November 2017, the Left Party has a statistically significant net loss of about 0.3 percent to the Green Party.
In relation to the 2014 parliamentary election, the Left Party has statistically significant net gains of about 1.2 percent from “Other parties”, about 0.6 percent from the Social Democrats and about 0.6 percent from the Green Party.
Green Party
If an election were held in May 2018, the Green Party would receive 4.3 ± 0.4 percent of the votes. This is a statistically significant increase compared with November 2017, while it is a statistically significant decrease compared with the 2014 parliamentary election.
In relation to November 2017, the Green Party has a statistically significant net gain of about 0.3 percent from the Left Party. At the same time, a statistically significant net loss of about 0.3 percent to the Moderate Party is noted.
In relation to the 2014 parliamentary election, the Green Party has statistically significant net losses of about 0.9 percent to the Social Democrats, about 0.7 percent to the Centre Party, about 0.6 percent to the Left Party, and about 0.2 percent to the Sweden Democrats.
Sweden Democrats
The Sweden Democrats would receive 18.5 ± 0.8 percent of the votes in an election in May 2018. This is a statistically significant increase compared with both November 2017 and the 2014 parliamentary election.
In relation to November 2017, the Sweden Democrats have statistically significant net gains of about 1.0 percent from the Moderate Party and about 0.4 percent from the Social Democrats.
Compared with the 2014 parliamentary election, statistically significant net gains are noted of about 2.5 percent from the Social Democrats, about 2.2 percent from the Moderate Party, about 0.3 percent from the Centre Party, about 0.3 percent from the Christian Democrats, and about 0.2 percent from the Green Party.
Other parties
The group “Other parties” would receive 2.9 ± 0.4 percent of the votes in an election in May 2018. Compared with November 2017, this is not a statistically significant change, while compared with the 2014 parliamentary election, it is a statistically significant decrease.
In relation to November 2017, “Other parties” have a statistically significant net gain of about 0.2 percent from the Social Democrats.
In relation to the 2014 parliamentary election, a statistically significant net gain of about 0.2 percent from the Liberal Party is noted. At the same time, “Other parties” has statistically significant net losses of about 1.2 percent to the Left Party and about 0.2 percent to the Centre Party.

* Figure 1 illustrates statistically significant net flows from November 2017 to May 2018 between the different parties. The numbers show significant net losses and net gains in percent of all those who submitted party answers or answered “do not know” when asked which party they would vote for in an election in each survey round. The flows cannot be used to calculate total changes in parties’ proportion of voters compared with November 2017. (Unweighted information is available in table 22 in the table publication published on 11 June.)

* Figure 2 illustrates statistically significant net flows from the 2014 parliamentary election to May 2018 between the different parties. The numbers show significant net losses and net gains in percent of all those who submitted information on the party they voted for in the 2014 parliamentary election and on the parties they would vote for in an election in May 2018. The flows cannot be used to calculate total changes in parties’ proportion of voters compared with the 2014 election because there are also flows between parties and the “do not know” group. (Unweighted information is available in table 21 in the table publication published on 11 June.)
Estimate of election results “if an election had been held today”, women (W) and men (M). May 2018
 and men (M). May 2018")
Estimate of election results “if an election had been held today”, women and men. May 2018
| Party | Women | Men | Total | ||||
|---|---|---|---|---|---|---|---|
| Percent | Margin of error | Percent | Margin of error | Percent | Margin of error | ||
| C | 10.0 | ±0.9 | 7.4 | ±0.8 | 8.7 | ±0.5 | |
| L | 4.6 | ±0.6 | 4.3 | ±0.6 | 4.4 | ±0.4 | |
| M | 21.1 | ±1.2 | 24.1 | ±1.3 | 22.6 | ±0.8 | |
| KD | 3.1 | ±0.5 | 2.7 | ±0.4 | 2.9 | ±0.3 | |
| S | 30.1 | ±1.3 | 26.5 | ±1.4 | 28.3 | ±0.8 | |
| V | 7.8 | ±0.8 | 7.1 | ±0.7 | 7.4 | ±0.5 | |
| MP | 5.2 | ±0.6 | 3.4 | ±0.5 | 4.3 | ±0.4 | |
| SD | 15.1 | ±1.1 | 21.9 | ±1.3 | 18.5 | ±0.8 | |
| others | 3.2 | ±0.6 | 2.7 | ±0.5 | 2.9 | ±0.4 | |
| C | L | M | KD | S | V | MP | SD | Övr | |||||||||||
|---|---|---|---|---|---|---|---|---|---|---|---|---|---|---|---|---|---|---|---|
| % | ± | % | ± | % | ± | % | ± | % | ± | % | ± | % | ± | % | ± | % | ± | ||
| Sydsverige | 8.5 | ±1.6 | 5.2 | ±1.2 | 22.2 | ±2.0 | 1.5 | ±0.7 | 27.6 | ±2.3 | 4.5 | ±0.9 | 5.3 | ±1.0 | 22.1 | ±1.9 | 3.2 | ±1.1 | |
| Småland med öarna | 9.7 | ±1.6 | 2.0 | ±0.8 | 19.4 | ±2.6 | 4.6 | ±1.1 | 28.1 | ±3.0 | 6.7 | ±1.2 | 4.4 | ±1.4 | 22.7 | ±2.9 | 2.3 | ±1.6 | |
| Västsverige | 9.2 | ±1.3 | 5.9 | ±1.1 | 22.1 | ±1.7 | 3.3 | ±0.6 | 25.4 | ±1.8 | 7.3 | ±1.2 | 4.4 | ±0.8 | 19.6 | ±1.8 | 2.7 | ±0.9 | |
| Stockholms län excluding Stockholm municipality | 8.1 | ±1.4 | 7.5 | ±1.3 | 31.5 | ±2.5 | 2.5 | ±0.7 | 21.3 | ±2.3 | 6.9 | ±1.3 | 3.6 | ±1.1 | 16.2 | ±2.1 | 2.5 | ±0.9 | |
| Stockholm municipality | 10.1 | ±2.1 | 6.3 | ±1.5 | 23.8 | ±2.4 | 3.4 | ±0.8 | 23.6 | ±2.9 | 13.2 | ±2.2 | 4.5 | ±1.6 | 10.3 | ±2.0 | 4.9 | ±1.5 | |
| Östra Mellansverige | 7.5 | ±1.1 | 3.1 | ±0.7 | 21.6 | ±1.8 | 2.6 | ±0.6 | 31.2 | ±1.9 | 6.9 | ±1.1 | 4.4 | ±1.0 | 19.5 | ±1.7 | 3.3 | ±1.0 | |
| Norra Mellansverige | 8.8 | ±1.8 | 1.6 | ±0.7 | 19.9 | ±2.7 | 3.0 | ±1.0 | 33.6 | ±3.0 | 7.9 | ±1.4 | 3.8 | ±1.1 | 18.7 | ±2.8 | 2.8 | ±1.3 | |
| Mellersta och övre Norrland | 8.7 | ±1.4 | 1.4 | ±0.8 | 18.9 | ±3.0 | 2.9 | ±0.9 | 39.2 | ±3.1 | 8.1 | ±1.3 | 2.8 | ±0.8 | 16.2 | ±2.9 | 1.8 | ±0.9 | |
| Total | 8.7 | ±0.5 | 4.4 | ±0.4 | 22.6 | ±0.8 | 2.9 | ±0.3 | 28.3 | ±0.8 | 7.4 | ±0.5 | 4.3 | ±0.4 | 18.5 | ±0.8 | 2.9 | ±0.4 | |
Description of the regions
Sydsverige: Blekinge län and Skåne län
Småland med öarna: Jönköpings län, Kronobergs län, Kalmar län and Gotlands län
Västsverige: Hallands län and Västra Götalands län
Östra Mellansverige: Uppsala län, Södermanlands län, Östergötlands län, Örebro län and Västmanlands län
Norra Mellansverige: Värmlands län, Dalarnas län and Gävleborgs län
Mellersta och övre Norrland: Västernorrlands län, Jämtlands län, Västerbottens län and Norrbottens län
From November 2017, Statistics Sweden publishes the estimate of election results “if an election had been held today” by region. Data concerning the period May 2014 – May 2018 is available in:
Definitions and explanations
The Party Preference Survey in May 2018 was conducted with a national random sample consisting of 8 951 persons entitled to vote in a parliamentary election, without an upper age limit. Answers from these people are collected through telephone interviews and online questionnaires. This form of mixed collection was introduced in the May 2015 survey. The sample persons were first given the option to answer the questions via an online questionnaire. If they did not reply via the online questionnaire, they were contacted via telephone later in the collection period. As in previous surveys, all available telephone numbers, both to mobile phones and home phones, have been used to contact the selected persons.
Among the sample persons, 23.2 percent could not be reached (including persons with unlisted telephone numbers and those without telephones). 3.4 percent were unable to be interviewed and 21.6 percent did not want to be interviewed. The total non-response rate was 48.3 percent. The total number of respondents was 4 632, which corresponds to 51.7 percent. In addition, Sometimes, some persons do not want to answer certain questions. The data was collected between 27 April and 29 May. A more detailed presentation of non-response is made available in connection with the publication on 11 June.
The results are presented in point estimates ± margins of error. The interval that is formed by the percent estimate ± margin of error here is a 95 percent uncertainty interval, which is an interval that, with 95 percent probability, includes the actual value of the population, if no systematic errors occur.
Publication
On 11 June, information about political party preferences in May 2018 will be published, in total and in different demographic groups. Statistics Sweden has opted to split up publication in order to publish “Election today estimate” as quickly as possible after completed data collection, and also to make it clear that it is concerns two different measurements. “Election today estimate” is measured using the question “Which party would you vote for if a parliamentary election was held in the next few days?”, while the political party preference is measured using the questions “Do you prefer one of the political parties more than the others?” and “Which party do you prefer the most?”.
The publication on 11 June also contains information about EU and euro preferences, in total and in different demographic groups.
Next publishing will be
The Political Party Preference Survey and EU and euro preferences in May 2018, in total and in different demographic groups, will be published on 11 June 2018 at 09.30.
Statistical Database
More information is available in the Statistical Database
Feel free to use the facts from this statistical news but remember to state Source: Statistics Sweden.