Economy-wide material flow accounts 2000–2016:
Swedish material consumption continues to increase
Statistical news from Statistics Sweden 2017-12-12 9.30
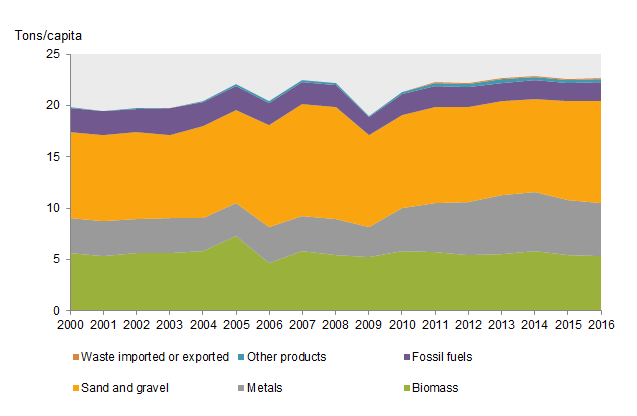
Material consumption in Sweden was 22.7 tonnes per person in 2016. This is 9 tonnes more per year than the EU average and amounts to a consumption of 62 kilogrammes per person and day. Since 2000, the material consumption per person has increased by about 3 tonnes, or 14 percent.
In 2016, the domestic material consumption in Sweden was 22.7 tonnes per person. This is an increase of about 3 tonnes since 2000. Consumption of metals in particular has increased (up 1.7 tonnes), although consumption of sand and gravel has also increased (up 1.6 tonnes). However, consumption of fossil fuels decreased (down 0.5 tonnes).
Source: Statistics Sweden
Comparing Sweden with the EU
In the EU, the average citizen consumes about 13 tonnes of materials every year, that is, about 9 tonnes less than the average Swedish citizen. One explanation for this difference is that Sweden has a higher consumption of biomass than the EU average due to an abundance of cultivated forests. Regarding fossil fuels, Sweden lies below the EU average, in part due to the use of fossil-free fuels in the heating of houses and buildings.
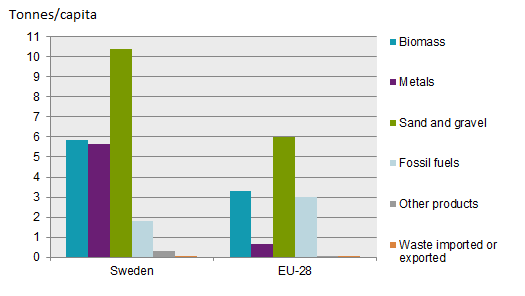
Source: Statistics Sweden (preliminary data for sand and gravel) and Eurostat (preliminary data). N.B.: Domestic material consumption is defined as domestic extraction + imports – exports.
Sweden has a high level of consumption of metals as a result of the mining industry generates large amounts of material. Sand and gravel represent a large proportion of Swedish material consumption, and these materials are both extracted, and for the most part consumed, in Sweden, i.e., import and export levels of sand and gravel are relatively low.
Countries with a limited supply of natural resources import more goods. This often means that the size of domestic material consumption becomes lower, since the imported goods have already been processed, and therefore have a lower mass than the raw materials from which the goods are made. This could explain why the EU average is substantially lower compared with Sweden’s material consumption.
Another difference between Sweden and an average EU country is that Sweden has a large area relative to its population size. A larger area often means more natural resources, which in Sweden’s case means a higher extraction of natural resources per person. This should be compensated when exports are subtracted in the calculation of Sweden’s material consumption. However, this is not the case, probably since the exported goods, as in the case of imports described above, have been processed and therefore have a lower mass than the raw materials from which the goods are made.
Resource productivity lower in Sweden compared to EU
Resource productivity is an indicator of the material efficieny of an economy. Sweden has a lower resource productivity than the EU average. This means that the amount of GDP generated per kg of consumed material is lower in Sweden compared to EU. In 2016, the resource productivity was 1.35 euro per kg and 1.79 kg per euro in Sweden and EU respectively. Furthermore, this difference has increased since year 2000, when Sweden had a slightly bigger resource productivity compared to EU. These figures are based on purchasing power parity-adjusted GDP data in constant 2000 prices.
Sweden has a low resource productivity due to its high levels of natural resources. Within EU there are several strong economies with low levels of natural resources, which affects the indicator on an EU aggregate level.
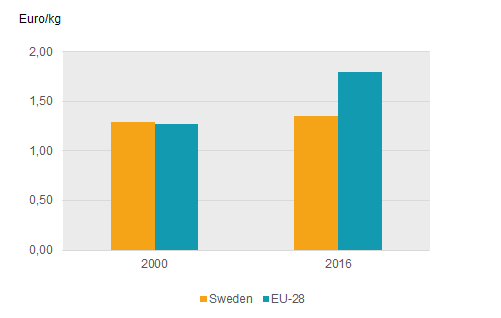
Source: Eurostat (preliminary data) and own calculations. N.B.: Resource productivity is based on purchasing power parity-adjusted GDP data in constant 2000 prices.
Definitions and explanations
The consumption of natural resources can be monitored in the system of economy-wide material flow accounts (EW-MFA). One of the main indicators of the EW-MFA is domestic material consumption (DMC), which measures the amount of material extracted in the country, plus imports minus exports.
Material flows are divided into the following main material categories: biomass, metals, non-metallic minerals (mainly sand and gravel), fossil fuels, other products and waste. These are further divided into about 40 subcategories.
The EW-MFA is used to measure the resource productivity of a country’s economy, and to examine the relationship between resource consumption and the GDP in comparisons between different countries’ environmental performance. For instance, the DMC indicator is used in the EU Roadmap to a Resource Efficient Europe (see link below).
Since 2013, the EW-MFA is included in the EU regulation on environmental accounts (see link below), which means EU Member States are obliged to report statistics on their material flows to the EU.
Feel free to use the facts from this statistical news but remember to state Source: Statistics Sweden.