Environmental Accounts – Emissions to air first quarter of 2018:
Greenhouse gas emissions increased in first quarter of 2018
Statistical news from Statistics Sweden 2018-08-30 9.30
Greenhouse gas emissions by the Swedish economy increased in the first quarter of 2018 compared with the same quarter 2017. This increase was mainly caused by higher emissions by the electricity, gas and heating industry. Emissions by the manufacturing industry remained unchanged. At the same time, the Swedish economy continues to grow.
New quarterly statistics from the Environmental Accounts at Statistics Sweden measuring emissions by Swedish economic actors and households are now available. In the first quarter of 2018, greenhouse gas emissions in the Swedish economy and households amounted to 16.5 million tonnes of carbon dioxide equivalents. This is 3.4 percent more than in the same quarter in 2017. In the same period, economic growth was 2.8 percent.
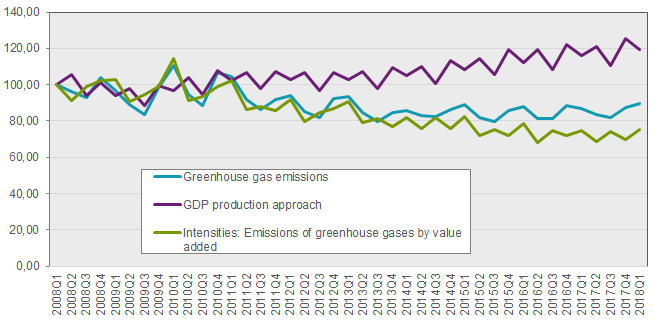
Source: Statistics Sweden, Environmental accounts and national accounts
The increased emissions in the first quarter of 2018 is mainly explained by higher greenhouse gas emissions by electricity, gas, heat, water and waste, where emissions rose by 12.8 percent compared with the same quarter in the previous year. Most greenhouse gas emissions come from electricity and heat production. Both emissions and value added in this industry vary seasonally and are often higher in the first and last quarter. The higher greenhouse gas emissions in the first quarter of 2018 are due to increased use of fossil fuels, such as natural gas, peat and coal as a result of the cold winter. However, emissions by electricity, gas and heat production in 2017 were relatively low, while emissions in the first quarter of 2018 are in line with the levels in the first quarter of 2015 and 2016.
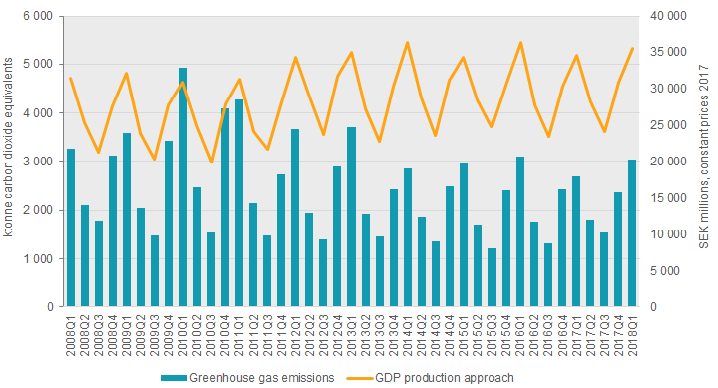
Source: Statistics Sweden, Environmental accounts and national accounts
Greenhouse gas emissions by the manufacturing industry remain relatively unchanged in the first quarter 2018 compared with the same quarter 2017. At the same time, value added in the manufacturing industry has increased by 4.0 percent. The increase in some industries, such as manufacture of wood, cork, paper and printing, was balanced by a decrease in other industries, for example manufacture of rubber and plastic products and the cement industry.
Greenhouse gas emissions in construction, the transport industry, and value added have also increased compared with the same quarter 2017. However, the estimated emissions in these industries should be interpreted with caution because of uncertainties in the model assessments.
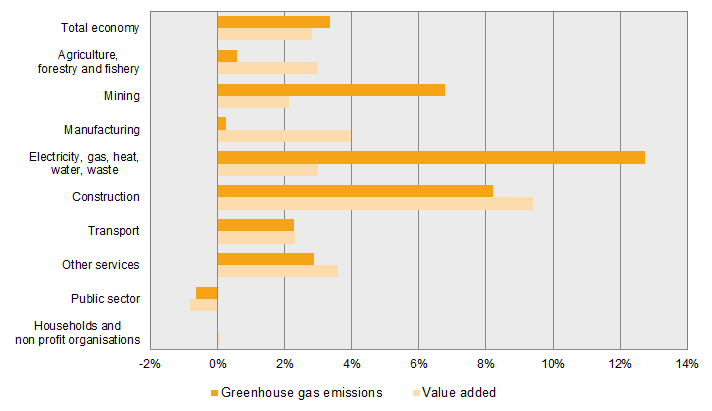
Source: Statistics Sweden, Environmental accounts and national accounts Note: Only non-profit institutions provide value added.
Developments in different industries
The connection between emissions of greenhouse gases and industry’s contribution to the Swedish economy varies between industries. Some industries are emissions-intensive, and increased production means higher emissions, while other industries may increase value added without any significant increase in emissions levels.
| Greenhouse gas emissions | Value added | ||||||
|---|---|---|---|---|---|---|---|
| NACE 2007 industry | 2018Q1 | Change compared with 2017Q1 | 2018Q1 | Change compared with 2017Q1 | |||
| Agriculture, forestry and fishery | 2 244 | 13 | 0.6% | 13 894 | 404 | 3.0% | |
| Mining | 505 | 32 | 6.8% | 7 445 | 155 | 2.1% | |
| Manufacturing | 3 476 | 10 | 0.3% | 165 949 | 6 362 | 4.0% | |
| Electricity, gas, heat, water, waste | 3 035 | 343 | 12.8% | 35 503 | 1 032 | 3.0% | |
| Construction | 474 | 36 | 8.2% | 60 999 | 5 241 | 9.4% | |
| Transport | 3 601 | 81 | 2.3% | 39 482 | 897 | 2.3% | |
| Other services | 797 | 22 | 2.9% | 476 115 | 16 515 | 3.6% | |
| Public sector | 163 | ‑1 | ‑0.6% | 220 830 | ‑1 772 | ‑0.8% | |
| Households and non-profit institutions [1] | 2 188 | 0 | 0.0% | 12 637 | 10 | 0.1% | |
| Total economy | 16 483 | 537 | 3.4% | 1 159 045 | 31 673 | 2.8% | |
[1] Only non-profit institutions provide value added.
Revisions
Since the previous publication on 2018-05-08, a number of revisions have been made:
- Emissions from mobile combustion in the first quarter of 2018 are estimated using a new model. An important source, Monthly fuel, gas and inventory statistics, has a new setting from January 2018. All information concerning 2018 based on this source is preliminary and will be revised, and the emissions statistics await this update. For this reason, the development of emissions from mobile combustion is calculated using a new model. A projection is made from Q1 2017 to Q1 2018 using economic growth. All in all, this uncertainty affects mobile combustion, which accounts for 45 percent of greenhouse gas emissions. This should be taken into account when reading the statistics. This applies mainly to the development in the first quarter 2018 in the transport sector, public sector, construction, other services, and households. The total estimation of increase in mobile combustion is approximately 2 percent in the first quarter of 2018 compared with the same quarter of the previous year.
- Updated values on diesel resulted in minor changes compared with the last quarter, mainly 2017Q1- 2017Q4.
- Minor updates were made in the manufacturing industry and in the production of electricity gas and heating, due to updates in the Quarterly fuel statistics.
More information (in Swedish) on the revisions is available on the Environmental Accounts’ product page under Documentation.
Definitions and explanations
The Environmental Accounts are compiled within the framework of the System of Environmental and Economic Accounts (SEEA) and present national environmental statistics and economic statistics in the same framework, using NACE industry classification. Environmentally-related statistics connected to the system of national accounts enable an analysis of the Swedish economy and the impact that each industry has on the environment.
Emissions to air according environmental accounts is based on a production perspective and defined by the nationality of economic actors. Direct emissions from Swedish economic actors are included, regardless of where in the world emissions occur. This is called the residence principle and includes three parts:
- Emissions within the Swedish territory
- Deduct emissions by aviation, navigation and land transport from foreign economic actors in Sweden
- Add emissions by aviation, navigation and land transport from Swedish economic actors abroad
As an approximation, the environmental accounts residence adjustment currently includes emissions from international bunkers, that is, international aviation and navigation arriving and refuelling at Swedish airports and harbours. A simplified assumption is thus made that emissions resulting from foreign land transports in Sweden are equal to emissions resulting from Swedish land transports abroad and that emissions related to what Swedish ships and planes bunker abroad are equal to emissions related to what foreign ships and planes bunker in Sweden.
Indirect emissions resulting from imports and other consumption of goods and services are not included. Emissions and removals resulting from land use and land use change (LULUCF) and carbon capture and storage (CCS) are not included.
Annual Environmental Accounts on emissions to air by industry currently has a production time of 15 months. There is a demand for more up-to-date statistics on emissions to air of greenhouse gases. To meet this need, Environmental Accounts at Statistics Sweden has developed quarterly statistics on emissions to air by industry, which are also used to produce preliminary annual statistics. These quarterly statistics are also used to produce preliminary data for T-1, and this data is delivered to Eurostat.
Quarterly statistics on all greenhouse gases and a number of air pollutants are available in Sweden’s Statistical Database. Excel spreadsheets are also available for download on Statistics Sweden’s website, and include data and figures on greenhouse gas emissions and emissions intensities by value added and per employee.
The SEEA analytical web tool contains the collected statistics about this area – from production to demand – including statistics on environmental economic steering instruments, economic development and environmental pressure from production and final demand.
Next publishing will be
The next statistical news, on quarterly emissions to air for the first quarter 2018, is scheduled for publication on 2018-10-25 at 09.30.
Statistical Database
More information is available in the Statistical Database
Feel free to use the facts from this statistical news but remember to state Source: Statistics Sweden.