Environmental accounts – Emissions to air Q3 2016:
Greenhouse gas emissions continue to increase
Statistical news from Statistics Sweden 2017-01-31 9.30
For the third quarter in a row greenhouse gas emissions continue to increase according to new statistics from Statistics Sweden’s Environmental Accounts. The increase is mainly in electricity and heat production, the transport industries and the manufacturing industry. Emissions from households decreased in the same period.
The Environmental Accounts at Statistics Sweden presents emissions to air from the Swedish economy, or ‘production-based’ emissions. Read more about ways of calculating emissions here (only in Swedish). Preliminary statistics on emissions by industry for the third quarter of 2016 are now available.
In the third quarter of 2016, greenhouse gas emissions from the Swedish economy and households amounted to 15.0 million tonnes of carbon dioxide equivalents. This is an increase of 2.8 percent compared with the same quarter in 2015, but a decrease compared with the same quarter in 2014. This is the third quarter in a row that emissions levels increase. Compared with 2015, GDP growth was 2.6 percent in the third quarter.
The increase in the emissions level is visible in several industries, although mainly in electricity, gas and heating, the transport industries and the manufacturing industry. The increased emissions in electricity, gas and heating production are a return from unusually low emissions levels in the second and third quarter of 2015 due to temporary disruptions at some plants. Increased emissions from the transport industries come from increased deliveries of fuels to both aviation and maritime traffic.
Emissions from households, which mainly arise from transport by car, decreased by 4.1 percent compared with the same quarter in 2015, due to reduced use of gasoline.
Economic growth is also visible in several industries. Other services, which account for a small share of total emissions, contribute most in total to the economic growth in the third quarter.
Revisions
Since the previous publication on 2016-10-31, a number of revisions have been made for quarters 2008Q1–2016Q2. This is because new information has been available, mainly for 2015. The quarterly emissions are estimated based on yearly statistics, and for 2015, new information regarding energy balance, national emissions statistics and emissions factors were available. The revisions mainly affect 2015Q1–2016Q2, where the emissions levels have been revised downwards.
More information (in Swedish) about this is available under Documentation.
Developments in different industries in the third quarter 2016
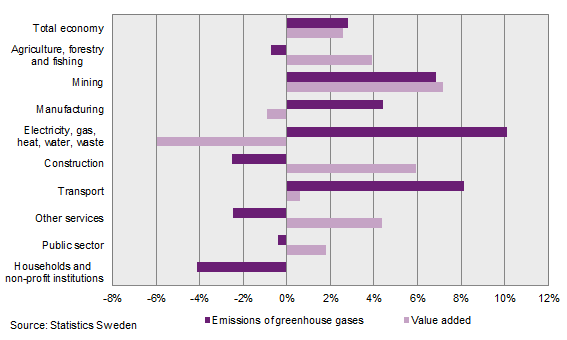
The connection between emissions of greenhouse gases and industry’s contribution to the Swedish economy varies between industries due to the different types of activities in each industry. Some industries are emissions-intensive, and increased production means higher emissions, while other industries may increase value added without any significant increase of emissions levels.
| Sector | Emissions of greenhouse gases | Value added | |||||
|---|---|---|---|---|---|---|---|
| 2016Q3 | Change compared to same quarter 2015 | 2016Q3 | Change compared to same quarter 2015 | ||||
| Agriculture, forestry and fishing | 2 368 | ‑17 | ‑0.7% | 12 065 | 455 | 3.9% | |
| Mining | 257 | 16 | 6.9% | 3 466 | 232 | 7.2% | |
| Manufacturing | 3 595 | 152 | 4.4% | 149 094 | ‑1 367 | ‑0.9% | |
| Electricity, gas, heat, water, waste | 1 353 | 124 | 10.1% | 21 895 | ‑1 386 | ‑6.0% | |
| Construction | 471 | ‑12 | ‑2.5% | 53 247 | 2 991 | 6.0% | |
| Transport | 3 611 | 272 | 8.2% | 40 305 | 233 | 0.6% | |
| Other services | 763 | ‑19 | ‑2.5% | 436 056 | 18 305 | 4.4% | |
| Public sector | 175 | ‑1 | ‑0.4% | 159 403 | 2 799 | 1.8% | |
| Households and non-profit institutions [1] | 2 439 | ‑105 | ‑4.1% | 12 132 | 176 | 1.5% | |
| Total economy | 15 033 | 410 | 2.8% | 887 663 | 22 438 | 2.6% | |
[1] Only non-profit institutions provide value added.
Agriculture, forestry and fishing: Agriculture, forestry and fishing accounted for 16 percent of total greenhouse gas emissions. Most greenhouse gases emitted in this sector (around 90 percent) come from agriculture. Emissions of greenhouse gases decreased by 0.7 percent in the third quarter compared with the same quarter of 2015. Forestry accounts for more than 70 percent of value added in this sector. Value added in the whole sector increased by 3.9 percent in the third quarter of 2016 compared with the same quarter of 2015.
Mining: Emissions from mining accounts for 2 percent of all emissions in the Swedish economy and households. Emissions increased by 6.9 percent in the third quarter compared with the same quarter of 2015.
Manufacturing: Manufacturing accounts for 24 percent of total greenhouse gas emissions in the Swedish economy and households. Greenhouse gas emissions increased by 4.4 percent in the third quarter of 2016 compared with the same quarter of 2015. In the period, value added decreased by 0.9 percent. Industries that contribute the most to greenhouse gas emissions are steel, metal, chemicals production, refineries and cement production. In the third quarter, emissions increased mainly in the chemical industry.
Electricity, gas, heat, water and waste: Greenhouse gas emissions in this sector annually account for 12 percent of total emissions of greenhouse gases from the Swedish economy and households. Most emissions of greenhouse gases (65 to 85 percent each quarter) come from electricity and heat production. Emissions levels in the third quarter 2016 were 10.1 percent higher than in the same quarter of 2015 but at the same level as emissions in the third quarter of 2014. The decrease in 2015 was due to temporary disruptions at some plants in the second and third quarter. In the period, value added decreased by 6.0 percent.
Construction: Greenhouse gas emissions in this sector account for 3 percent of total greenhouse gas emissions in the Swedish economy and households. Emissions arise mainly from transport, machinery and industrial vehicles. In the third quarter of 2016, model-estimated emissions decreased by 2.5 percent, while value added increased by 7.1 percent compared with the same period in 2015.
Transport: Greenhouse gas emissions in the transport industry account for 24 percent of total emissions in the Swedish economy and households. Emissions increased by 8.2 percent in the third quarter in 2016 compared with the same quarter in 2015. Emissions come mainly from maritime traffic, but the increase in the third quarter is from both maritime traffic and aviation. Value added increased by 0.6 percent in the third quarter of 2016 compared with the same quarter of 2015.
Other services: Greenhouse gas emissions in the transport sector account for 5 percent of total emissions in the Swedish economy and households. Emissions in these industries are relatively small compared to value added and are mainly due to transports. In the third quarter of 2016, emissions decreased by 2.5 percent, while value added increased by 4.4 percent compared with the same quarter in 2015.
Public sector: Greenhouse gas emissions in the public sector (central government, county and municipality) account for about 1 percent of total emissions in the Swedish economy and households. Emissions arise mainly from working machinery and transports. Emissions decreased by 0.4 percent in the third quarter of 2016 compared with the same quarter in 2015. Value added increased 1.8 percent in the same period.
Households and non-profit institutions: Greenhouse gas emissions from households and non-profit institutions account for 16 percent of total emissions in the Swedish economy and households. Emissions arise mainly from households’ car transport. Greenhouse gas emissions decreased by 4.1 percent in the third quarter of 2016 compared with the same quarter in 2015 due to reduced use of gasoline. Only non-profit institutions contribute with a small level of value added.
Definitions and explanations
The Environmental Accounts are compiled within the framework of the System of Environmental and Economic Accounts (SEEA) and show national environmental statistics and economic statistics in the same framework using NACE industry classification. Environmentally-related statistics connected to the system of national accounts enable an analysis between the Swedish economy and the impact that each industry has on the environment. Emissions from international bunkers, that is, international aviation and navigation arriving and refuelling at Swedish airports and harbours are included. Emissions and removals from land use and land use change (LULUCF) and carbon capture and storage (CCS) are not included.
Annual Environmental Accounts on emissions to air by industry currently has a production time of 18 months. There is a demand for more up-to-date statistics on emissions to air of greenhouse gases. To meet this need, the Environmental Accounts at Statistics Sweden have developed quarterly statistics on emissions to air by industry that also is used to produce preliminary annual statistics.
Quarterly statistics on all greenhouse gases and a number of air pollutants are available in Sweden’s Statistical Database. Excel spreadsheets are also available for download on Statistics Sweden’s website, and include data and figures on greenhouse gas emissions and emissions intensities by value added and by employees.
The statistics on air emissions are based on a production perspective. Emissions are reported for the industry where emissions occur. Indirect emissions from imports and other consumption of goods and services are not included.
Statistics on emissions to air provided by the Swedish Environmental Protection Agency (EPA) follow the UNFCCC framework, and report for emissions within the Sweden’s territory. Sectors are listed by emissions category, not by industry. Emissions and removals from land use and land use change are included, while emissions from international aviation and navigation are reported separately. Read more about emissions statistics from the Swedish EPA (in Swedish only) and about different methodologies for calculating emissions.
Next publishing will be
The next statistical news on quarterly emissions to air up to and including the fourth quarter of 2016 is scheduled for 2017-05-04 at 09:30. Preliminary annual statistics for 2016 is also published at the same time.
The next statistical news on annual emissions to air 2008–2015 (final statistics) is scheduled for publication on 2017-03-29 at 09:30.
Statistical Database
More information is available in the Statistical Database
Feel free to use the facts from this statistical news but remember to state Source: Statistics Sweden.