Shareholders statistics, June 2016:
Decreasing share wealth
Statistical news from Statistics Sweden and Swedish Financial Supervisory Authority 2016-08-26 9.30
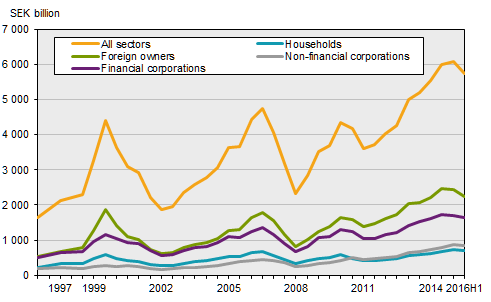
The total wealth in shares in companies listed on the Swedish market was valued at SEK 5 745 billion at the end of June 2016. This is a decrease of SEK 334 billion compared to the turn of the year.
At the end of June, households' share wealth was valued at SEK 706 billion. This is a decrease of SEK 18 billion compared to the turn of the year.
The average portfolio of those who directly own shares was SEK 475 000 at the end of June. This is a decrease of SEK 17 000 compared with the corresponding figure at the end of last year. For women, the average portfolio was worth SEK 364 000 while the average portfolio of men was worth SEK 554 000.
Looking at the median portfolio, that is, the middle value, we see it was worth SEK 26 000 at the end of June, a decrease of SEK 2 000 since the end of the year. For women, the median portfolio was worth SEK 23 000 while the median portfolio of men was worth SEK 29 000.
The big difference between the average and the median portfolio is because share wealth is very unevenly distributed with a relatively small number of individuals who own a large part of the stock market value. At the end of June, the 5 percent of the owners with the largest holdings owned about 79 percent of the wealth in shares.
The share wealth of households does not include share-related investments in funds and unit-linked savings.
Record number of listed companies
At the end of June there were 684 companies listed on the Swedish market, which is the highest listing ever and an increase of 42 companies compared to December 2015.
The US is largest owner in the foreign owners sector
At the end of June 2016, foreign ownership of shares listed on the Swedish market amounted to a value of SEK 2 230 billion. This represents 38.8 percent of the total stock market value and means that foreign ownership is the largest ownership sector of shares listed in Sweden.
As previously, the US and the UK continue to be the largest single holders of Swedish shares within the foreign owners sector. Their shares of ownership were respectively 30.7 and 26.4 percent of total holdings of the foreign ownership sector. Among the Nordic countries, Finland is the largest single holder of Swedish shares, owning 4.6 percent of foreign ownership.
| Year | Non-financial enterprises | Financial enterprises | Central govern- ment | Local govern- ment | Social- security funds | Households | Non-profit organisation | Foreign owners | Total value, SEK billion |
|---|---|---|---|---|---|---|---|---|---|
|
2016 Jun
|
13.7 | 27.1 | 1.3 | 0.0 | 2.7 | 12.3 | 4.1 | 38.8 | 5 745 |
|
2015 Dec
|
13.5 | 26.6 | 1.4 | 0.0 | 2.5 | 11.9 | 4.1 | 40.0 | 6 079 |
|
2015 Jun
|
12.2 | 27.2 | 1.6 | 0.0 | 2.5 | 11.2 | 4.2 | 41.0 | 6 000 |
|
2014 Dec
|
12.4 | 27.8 | 1.8 | 0.0 | 2.6 | 11.1 | 4.4 | 39.9 | 5 542 |
|
2014 Jun
|
12.0 | 27.8 | 1.9 | 0.0 | 2.6 | 11.2 | 4.4 | 40.0 | 5 187 |
|
2013 Dec
|
11.9 | 26.9 | 2.0 | 0.0 | 2.8 | 10.9 | 4.4 | 41.0 | 5 010 |
|
2013 Jun
|
11.4 | 27.4 | 2.5 | 0.0 | 3.0 | 10.9 | 4.3 | 40.5 | 4 272 |
|
2012 Dec
|
11.5 | 27.6 | 2.9 | 0.0 | 2.8 | 10.8 | 4.1 | 40.3 | 4 039 |
|
2012 Jun
|
12.1 | 27.2 | 3.1 | 0.0 | 3.1 | 11.3 | 4.0 | 39.2 | 3 715 |
|
2011 Dec
|
12.0 | 27.8 | 3.1 | 0.0 | 3.3 | 11.2 | 3.9 | 38.7 | 3 611 |
|
2011 Jun
|
11.5 | 29.1 | 3.0 | 0.0 | 3.0 | 11.4 | 3.9 | 38.1 | 4 185 |
|
2010 Dec
|
9.2 | 28.7 | 3.8 | 0.0 | 3.1 | 13.3 | 4.1 | 37.8 | 4 342 |
|
2010 Jun
|
8.9 | 28.9 | 4.1 | 0.0 | 3.2 | 13.7 | 4.1 | 37.1 | 3 701 |
|
2009 Dec
|
9.1 | 29.1 | 4.7 | 0.0 | 3.4 | 13.9 | 4.3 | 35.4 | 3 518 |
|
2009 Jun
|
9.5 | 27.8 | 4.7 | 0.1 | 3.5 | 14.5 | 4.3 | 35.8 | 2 852 |
|
2008 Dec
|
9.5 | 27.4 | 4.6 | 0.1 | 3.5 | 14.5 | 4.6 | 35.8 | 2 313 |
|
2008 Jun
|
10.2 | 27.3 | 4.2 | 0.1 | 3.7 | 13.7 | 4.5 | 36.4 | 3 182 |
|
2007 Dec
|
9.4 | 26.9 | 4.5 | 0.1 | 3.2 | 13.4 | 4.4 | 38.0 | 4 064 |
|
2007 Jun
|
9.0 | 27.6 | 3.7 | 0.1 | 3.1 | 14.0 | 4.7 | 37.9 | 4 734 |
|
2006 Dec
|
9.0 | 27.0 | 4.5 | 0.1 | 3.2 | 14.3 | 4.8 | 37.2 | 4 425 |
|
2006 Jun
|
9.9 | 27.9 | 4.2 | 0.1 | 3.2 | 14.4 | 4.7 | 35.6 | 3 665 |
|
2005 Dec
|
8.4 | 28.6 | 4.4 | 0.1 | 3.5 | 14.8 | 4.8 | 35.3 | 3 627 |
|
2005 Jun
|
8.3 | 28.9 | 4.5 | 0.1 | 3.7 | 15.3 | 4.5 | 34.6 | 3 054 |
|
2004 Dec
|
8.7 | 28.5 | 5.2 | 0.2 | 3.8 | 15.0 | 4.7 | 33.9 | 2 768 |
|
2004 Jun
|
8.0 | 29.6 | 4.6 | 0.2 | 4.0 | 14.8 | 4.6 | 34.1 | 2 586 |
|
2003 Dec
|
9.2 | 28.7 | 5.5 | 0.2 | 4.1 | 14.4 | 4.6 | 33.1 | 2 354 |
|
2003 Jun
|
8.8 | 29.3 | 5.6 | 0.2 | 4.3 | 14.5 | 4.8 | 32.4 | 1 953 |
|
2002 Dec
|
8.5 | 28.9 | 5.7 | 0.2 | 4.1 | 14.3 | 4.8 | 33.5 | 1 869 |
Definitions and explanations
Information refers to shares on the Stockholm exchange (except for the external list), Aktietorget, NGM's lists and First North. Unlisted classes of shares in listed companies are also included. Shares of foreign companies that are noted on the above mentioned marketplaces have been included in the statistics from 2000 onwards.
Publication
A more detailed report of this survey is published in a Statistical Report.
Statistical Database
More information is available in the Statistical Database
Feel free to use the facts from this statistical news but remember to state Source: Statistics Sweden.