Final income and taxes 2016:
Incomes rose in 2005–2016, and they rose most among women
Statistical news from Statistics Sweden 2018-01-31 9.30
The median value of total income has increased by 25 percent among women and by 19 percent among men since 2005, taking into account inflation.
Incomes in Sweden are rising. The median value of total income from employment and business in the 20–64 age group was SEK 309 000 in 2016. This amounts to an increase of 2.5 percent between 2015 and 2016, and of 22 percent between 2005 and 2016, calculated in constant prices.
Women’s incomes have increased more than men’s incomes
The increase has been 25 percent among women and 19 percent among men since 2005. In the 20–64 age group, women’s median income was 82 percent of men’s income in 2016. In 2010, this share was 79 percent, and in 2005 it was 78 percent.
Incomes among women aged 65 years or older have also increased more rapidly than among men – 24 percent among women compared with 16 percent among men – in the period 2005–2016. In 2016, women in this age group had total income from employment and business, which includes pensions, corresponding to 73 percent of men’s income. In 2005, the corresponding share was 68 percent.
Since the age of how long you have the right to work was raised from 65 to 67 years, the percentage of gainfully employed persons of this age has increased sharply, which has affected income development. Among people aged 65–67, the median income rose by nearly 40 percent among women and by more than 30 percent among men between 2005 and 2016.
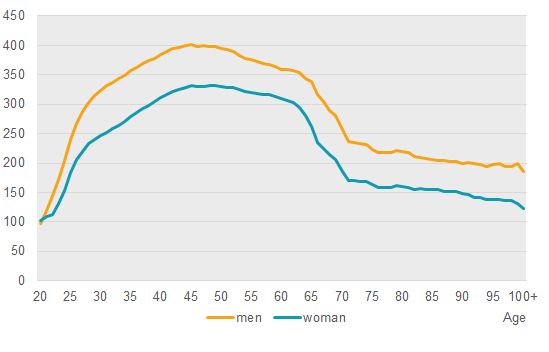
Highest incomes among those aged 45 and 50
Incomes vary between various ages. Among men, the median income is highest for those aged 42 to 51, where it exceeds SEK 390 000. Men aged 45 have the highest median income, SEK 402 000. Among women, the median income is highest for those aged 43 to 52, where it exceeds SEK 325 000. Women aged 49 have the highest median income, SEK 332 000.
Highest incomes in metropolitan municipalities
There are major regional variations with respect to income. The highest annual income in 2016 in the 20–64 age group, SEK 418 000, was in Danderyd municipality, and municipalities at the top of the list are mainly those in metropolitan areas. Kiruna and Gällivare are exceptions, and are in ninth and eleventh place respectively among Sweden’s 290 municipalities. The annual income was below SEK 300 000 in 125 municipalities.
The increase in the median income since 2005 was largest in Gällivare, where it increased by 33 percent. Five out of seven municipalities with the most positive income development between 2005 and 2016 are located in Norrbotten County. The remaining four are Kiruna, Arjeplog, Överkalix and Pajala. In 88 municipalities, growth was lower than 20 percent.
Positive income development, but with growing gaps
Households’ economic standard has developed favourably. The real economic standard has increased by 35 percent since 2005. Income gaps have grown gradually during the period. In 2005, the Gini coefficient was 0.271. In 2010 it had risen to 0.297 and in 2016 it was 0.320 – the highest listing since measurements began.
The percentage of people at risk of poverty has also increased in the same time period, from 10 percent in 2005 to 14 percent in 2016. However, this percentage decreased slightly between 2015 and 2016.
The half of the population with the lowest income had about 29 percent of total disposable income in Sweden. This is lower than in 2005, when the proportion was 32 percent. At the same time, the proportion grew from 24 to 27 percent in the 10th decile (the tenth of the population with the highest income). This means that the 10th decile’s share of total disposable income is nearly equal to the share of the half of the population with the lowest income.
Foreign born people have a lower economic standard than Swedish born people. In 2016, the economic standard among foreign born persons corresponded to 77 percent of the economic standard among Swedish born persons. In 2005, this proportion was 82 percent, that is, differences between foreign born persons and Swedish born persons were greater in 2016 than in 2005.
Definitions and explanations
Economic standard To make comparisons of disposable income among different types of households, a system is used that takes into account the composition of the household. The disposable income is divided by the number of consumption units in the household.
Total income from employment and business total income from employment and business refers to the sum of income from employment and income from business activities. Income from employment refers to primarily the sum of salary, pension, sickness benefit, parental allowance, sickness and activity compensation and unemployment benefits.
Disposable income Disposable income refers to the sum of all household members’ taxable and non-taxable income minus taxes and other negative transfers (such as repaid student loans).
Feel free to use the facts from this statistical news but remember to state Source: Statistics Sweden.