Demographic analysis: Having children or not? A register-based follow-up on a questionnaire survey from 2009:
Eight out of ten of those who wanted children had them
Statistical news from Statistics Sweden 2017-06-22 9.30
In the spring of 2009, a questionnaire survey was carried out regarding the attitudes to childbearing in the near future. Approximately 3 600 women and men of childbearing ages, with and without children at the time of the survey, have now been followed-up in registers regarding their actual childbearing before 2015. In total, four out of ten of those who had at least one child and approximately eight out of ten of those who wanted children also had children in the six-year follow-up period.
The propensity to have children was highest for those who already had one child
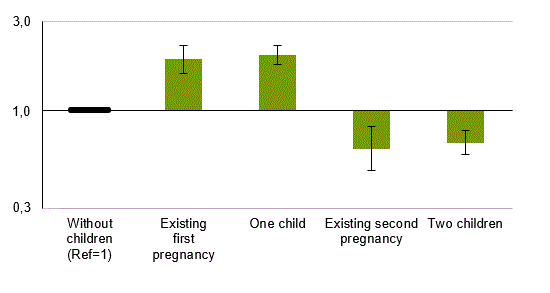
Nearly 1 400 parents had two children at the beginning of the follow-up period. Of those, 24 percent had one or more children before 2015. There were approximately 850 individuals without children and of those, 40 percent had one or more children before 2015. Figure 1 shows the propensity to have at least one child before 2015, by number of children and existing pregnancy among the respondents or their partners in 2009. A greater number of respondents without children in 2009 actually had children, compared with parents of two children and parents who were expecting their second child; this is most likely the result of the strong two-child norm in Sweden. Those who had one child or were expecting their first child were most likely to have children within six years.

Attitudes are clearly linked to actual childbearing
For people with children, their attitudes to future childbearing was measured with the question “Do you believe you will have more children within the next 5–6 years?” The possible answers, “Yes”, “Maybe”, Probably not” and “Not” were analysed in relation to the actual childbearing of people who had one or two children when they responded to the survey in the spring of 2009. Of the women who had one or two children and wanted additional children within six years, roughly eight out of ten had at least one more child – 86 percent and 79 percent, respectively. Among the men, the share was nearly as high – 79 percent and 78 percent, respectively. The percentage of those who had children was lower among those who responded “Maybe”, considerably lower among those who responded “Probably not” and the lowest among those who responded “No”.
| Number of children in 2009 | Women | Men | |||||||
|---|---|---|---|---|---|---|---|---|---|
| More children within 5-6 years? | Number who had children | Totalt | Share (percen-tage) | Confidence interval of 95% | Number who had children | Totalt | Share (percen-tage) | Confidence interval of 95% | |
| One child | |||||||||
| Yes | 238 | 284 | 86.4 | (82.3–90.4) | 65 | 84 | 78.9 | (69.6–88.1) | |
| Maybe | 56 | 105 | 63.0 | (52.6–73.4) | 21 | 47 | 49.7 | (34.0–65.3) | |
| Probably not/No* | 10 | 71 | 20.7 | (8.4–32.9) | 10 | 55 | 23.9 | (10.6–37.1) | |
| Two children | |||||||||
| Yes | 60 | 77 | 79.0 | (69.6–88.5) | 47 | 61 | 78.3 | (67.5–89.2) | |
| Maybe | 80 | 190 | 43.1 | (35.7–50.5) | 62 | 144 | 45.8 | (37.1–54.5) | |
| Probably not | 25 | 183 | 13.2 | (8.1–18.2) | 35 | 198 | 17.9 | (12.2–23.5) | |
| No | 10 | 239 | 5.2 | (1.9–8.4) | 20 | 271 | 8.6 | (4.9–12.3) | |
Parents who reported having one or two children and who were not expecting a child in 2009. The percentages have been adjusted upwards using weights corresponding to the size of the population. *The category is a combination of the responses ”Probably not” and ”No”.
Women’s attitudes are somewhat more certain than men’s attitudes
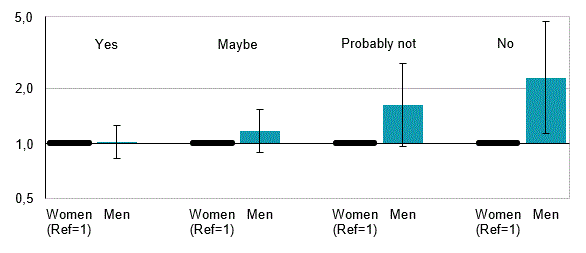
There is no difference between sexes as regards the share who had more children within six years after the survey in 2009 among those who responded “Yes” or “Maybe” to the question on more children in the next 5–6 years. Among those who expressed greater uncertainty or did not believe they would have more children, a significantly higher share of men than women actually went on to have children, see figure 2. This could possibly be interpreted as men not being as certain as women about future children, or that men change their views more frequently than women

Approximately every third younger person who did not believe in more children still had children
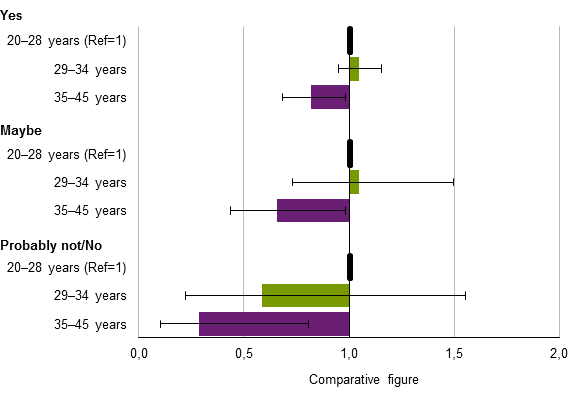
Relatively fewer children were born to those who were 35–45 years old at the birth of their first child and responded “Probably not” or “No” compared with the youngest age group, those aged 20–28 (figure 3). The youngest age group largely had children within six years, even if they responded “Probably not” or “No” in 2009; 39 percent compared with 11 percent in the oldest age group. A similar pattern with a lower propensity for having children in the older age groups compared with the youngest age groups is reported for those who responded “Yes” and “Maybe”. The result was roughly the same for those who had two children when they responded to the questionnaire.

Definitions and explanations
Explanation of comparative figures in the charts
In charts that report results from regression analyses, a reference group and comparative figures have been used. The reference group has the comparative figure 1. A value greater than one indicates that the group has a greater propensity to have children, and a lower value indicates a lower propensity to have children, compared to the propensity of the reference group. The propensity to have children in the reference groups have been checked against age group and sex. Uncertainty in the questionnaire survey has been provided using a 95 percent confidence interval. Figures from the charts are stated in the report.
Any percentages mentioned have been adjusted upwards using weights so that they represent data for the population.
Publication
Demographic report: Having children or not. A register-based follow-up on a questionnaire survey from 2009. In Swedish with summary in English.
Feel free to use the facts from this statistical news but remember to state Source: Statistics Sweden.
