Turnover in retail trade, March 2017:
Retail trade increased in March
Statistical news from Statistics Sweden 2017-04-28 9.30
The retail trade sales volume increased by 1.9 percent in March compared with the same month last year. Retail sales in consumables increased by 0.2 percent, while retail sales in durables increased by 2.4 percent. This information is working-day adjusted.
The turnover in retail trade measured in current prices increased by 1.0 percent from March 2016 to March 2017. Retail trade in consumables (such as goods sold in department stores and specialised grocery stores) decreased by 2.2 percent, while durables (such as clothing stores, furniture stores, second-hand goods stores and mail order houses) increased by 3.7 percent.
Retail trade decreased by 0.4 percent between February 2017 and March 2017. In the last three-month period (January–March), sales decreased by 0.1 percent compared with the previous three-month period (October–December). Both of these figures are expressed in constant prices, working-day and seasonally adjusted.
Comments by Andreas Svensson, HUI Research:
The preliminary retail sales figure was about SEK 60.6 billion in March, which corresponds to an increase of 1.0 percent in current prices compared with the same period last year. An important explanation for the weak outcome of the month is that the comparison is made with the Easter month of March 2016. Easter is the second most important period of the year with regard to grocery sales, surpassed only by Christmas, resulting in more than 20 percent higher sales than in a normal week. As a result, the preliminary sales growth for consumables in March 2017 was weak, and was at minus 2.2 percent. Adjusted for the negative Easter effect, consumables sales increased by 1.9 percent. However, almost the entire growth is explained by price increases, and the price-adjusted growth was basically non-existent. Our assessment is that the preliminary growth rate for consumables for the first quarter is likely to be revised up by just over a percentage point when the final estimate is made in May. The background to this assessment is, in part, that the industry’s development is very weak in terms of actual population growth.
Preliminary sales growth for durables increased by 3.7 percent in March. Easter is unfavourable to durable sales, since public holidays create interest in activities other than shopping, making last year’s comparative figures weak. Despite this, several sub-sectors had a tough month. Clothing and sports have had a miserable start to the year and had declining sales figures also in March. This year’s winter season, with its lack of snow and cold, has proved to be unusually tough for the industries, and the start of the spring season has not improved the prospects. Given that Easter was in April this year, these industries will probably have to wait a while for a turnaround. Retail’s exclamation mark, the construction industry, has shown strong progress since the beginning of 2017, and March was no exception. Construction sales increased by 12.8 percent. The industry is on the rise, with a negative interest rate and a boom, but the strong development cannot be attributed to the consumer market. According to the Swedish Tax Agency, both the number of ROT buyers and ROT payouts have decreased in 2017. The sales gap likely stems from a new, very strong production market.
In summary, HUI estimates that the prospects for the retail year 2017 are good, largely due to a strong population growth and an increasing number of people employed. At the same time, retail trade has a weaker growth rate than in previous years due to the fact that the purchasing power is at a very high level. HUI’s forecast for the full year 2017 is an increase of 3 percent for retail trade in total.
| sep% | okt% | nov% | dec% | jan% | feb% | |
|---|---|---|---|---|---|---|
EU |
1.9 | 3.8 | 4.0 | 2.4 | 1.7 | 2.5 |
Euro zone |
0.9 | 3.1 | 2.7 | 1.4 | 1.6 | 1.9 |
Sweden |
1.5 | 2.7 | 4.0 | 1.0 | 2.3 | 2.6 |
| Mar | Apr | Maj | Jun | Jul | Aug | Sep | Okt | Nov | Dec | Jan | Feb | Mar | |
|---|---|---|---|---|---|---|---|---|---|---|---|---|---|
|
Turnover 2010=100
|
113.0 | 114.1 | 122.7 | 124.9 | 119.3 | 120.0 | 114.1 | 118.6 | 122.1 | 143.4 | 104.3 | 98.8 | 114.2 |
|
Monthly development %*
|
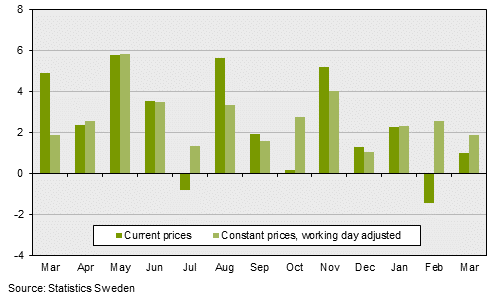
4.9 | 2.4 | 5.8 | 3.5 | -0.8 | 5.6 | 1.9 | 0.2 | 5.2 | 1.3 | 2.2 | -1.5 | 1.0 |
|
3-month development %**
|
5.6 | 5.2 | 4.4 | 3.9 | 2.8 | 2.7 | 2.2 | 2.5 | 2.4 | 2.1 | 2.8 | 0.8 | 0.6 |
|
12-month development %**
|
5.8 | 5.7 | 5.9 | 5.6 | 4.7 | 4.9 | 4.5 | 4.0 | 3.8 | 3.4 | 3.3 | 2.6 | 2.2 |
| Mar. | Apr. | May | Jun. | Jul. | Aug. | Sep. | Oct. | Nov. | Dec. | Jan.^ | Feb.^ | Mar^ | |
|---|---|---|---|---|---|---|---|---|---|---|---|---|---|
|
Turnover 2010=100
|
112.3 | 115.0 | 124.0 | 126.1 | 122.2 | 120.3 | 113.1 | 120.5 | 121.9 | 142.2 | 107.2 | 100.7 | 114.4 |
|
Monthly development %*
|
1.9 | 2.5 | 5.8 | 3.5 | 1.3 | 3.3 | 1.5 | 2.7 | 4.0 | 1.0 | 2.3 | 2.6 | 1.9 |
|
3-month development %**
|
3.3 | 2.7 | 3.4 | 4.0 | 3.5 | 2.7 | 2.1 | 2.5 | 2.8 | 2.5 | 2.4 | 1.9 | 2.2 |
|
12-month development %**
|
4.6 | 4.5 | 4.6 | 4.4 | 3.9 | 3.9 | 3.6 | 3.4 | 3.2 | 2.9 | 2.8 | 2.7 | 2.7 |
| Mar. | Apr. | May | Jun. | Jul. | Aug. | Sep. | Oct. | Nov. | Dec. | Jan.^ | Feb.^ | Mar.^ | |
|---|---|---|---|---|---|---|---|---|---|---|---|---|---|
|
Turnover 2010=100
|
116.9 | 117.2 | 120.1 | 118.4 | 117.8 | 118.6 | 118.3 | 119.3 | 121.2 | 118.2 | 119.6 | 120 | 119.5 |
|
Development %***
|
-0.2 | 0.3 | 2.5 | -1.4 | -0.5 | 0.7 | -0.3 | 0.9 | 1.6 | -2.5 | 1.2 | 0.3 | -0.4 |
|
Development for the latest 3 month %****
|
0.3 | 0.2 | 1.0 | 1.3 | 1.5 | 0.2 | -0.3 | -0.1 | 1.1 | 1.1 | 0.8 | -0.3 | 0.1 |
|
Development for the latest 6 month %****
|
1.7 | 1.5 | 1.4 | 1.4 | 1.4 | 1.3 | 1.3 | 1.5 | 1.2 | 0.9 | 1.1 | 1.0 | 1.0 |
Definitions and explanations
Total retail trade refers to NACE 47 excluding 47.3.
Trade in consumables here refers to NACE 47.11 and 47.2.
Durables here refer to NACE 47.19 and 47.4-47.7.
All time series use the year prior to the year of the survey as their base year. Contact HUI Research for more detailed reports of the retail trade activities.
Revisions
When the Retail Trade Index is published for a new month, the index for previous months is also revised if new information has been added. From April 2015, a new method to calculate definitive statistics was introduced. The new method entails primarily that administrative data from the Swedish Tax Agency is used quarterly to increase the number of companies that are investigated and reduce the burden of the companies to contribute data. This means that definitive quarterly statistics are based on a calculation for all the companies in the population. The reason to use administrative data every quarter is to improve the quality of the retail trade index. Usually the material is revised between two and four months backwards depending on where in the quarter the reference month is. In connection with the publication of the first and second month in a quarter the entire previous quarter is revised. The series, corrected for calendar and seasonal effects and trend estimates is always revised from January 1991 and forward. Information regarding major revisions will be published at www.scb.se/ha0101.
More information:
Enquiries about the Retail Trade Index should be referred to Andreas Svensson at HUI Research +46 8 762 72 85.
Next publishing will be
Data for April will be published on 30 May at 09:30.
Statistical Database
More information is available in the Statistical Database
Feel free to use the facts from this statistical news but remember to state Source: Statistics Sweden.