Industrial capacity utilisation, first quarter 2025
Increased capacity utilisation in industry
Statistical news from Statistics Sweden 2025-05-21 8.00
Capacity utilisation in industry increased by 0.5 percentage points in the first quarter of 2025 compared with the fourth quarter of 2024 in seasonally adjusted figures.
The increase in capacity utilisation in industry in the first quarter led to an increase in the level of utilisation, which amounted to 88.0 percent in seasonally adjusted figures.
On an annual basis, capacity utilisation decreased by 0.6 percentage points compared with the first quarter of 2024 and amounted to 88.2 percent in calendar adjusted figures.
The figures for the first quarter of 2025 are preliminary. Since the previous publication capacity utilisation in the fourth quarter of 2024 has been revised downwards by 0.2 percentage points with the utilisation rate 87.5 percent, in seasonally adjusted figures.
In calendar adjusted figures capacity utilisation in the fourth quarter of 2024 has been revised downwards by 0.3 percentage points to a utilisation rate of 87.1.
1) Calendar and seasonally adjusted figures 2) Calendar adjusted figures
Reasons for Lower Capacity Utilisation
When businesses have a capacity utilisation rate of less than 100 percent, they must specify a primary reason for the lower capacity utilisation. The response options are fixed, and only one option can be selected. The shares of responses for each reason are distributed according to the diagram below. The responses are unweighted, unlike the capacity utilisation, which is weighted by industrial turnover.
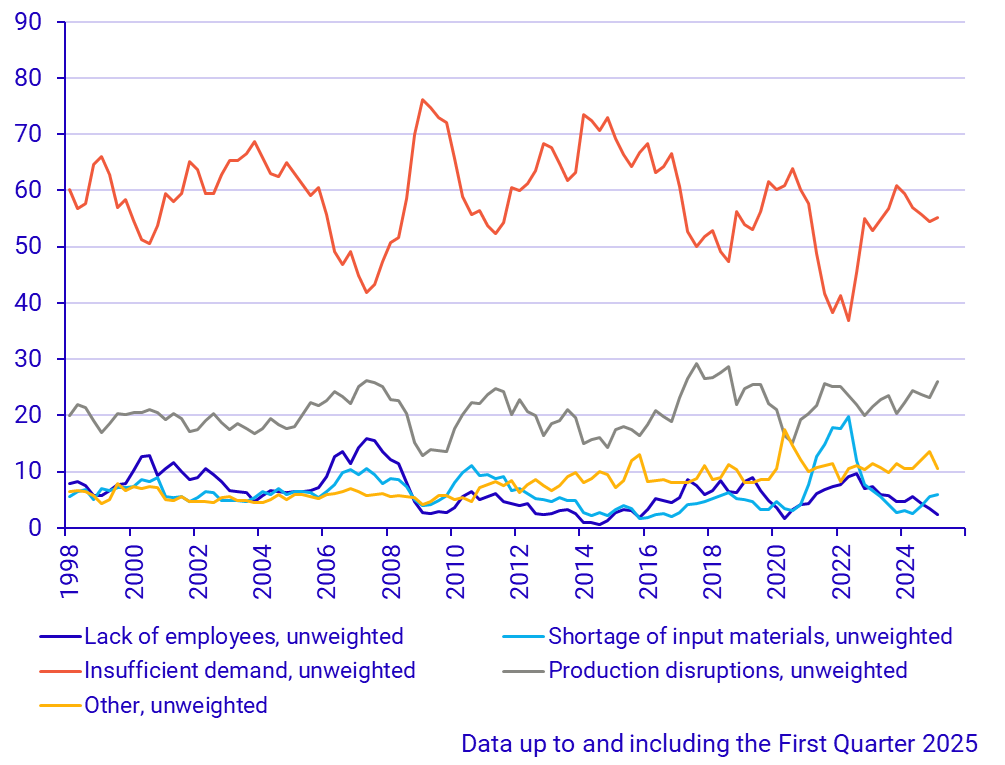
| Reason for lower capacity utilization | Shares | |||||||
|---|---|---|---|---|---|---|---|---|
| 2024 | 2025 | Q1 2025-Q4 2024 | Q1 2025-Q1 2024 | |||||
| Q1 | Q2 | Q3 | Q4 | Q1 | ||||
| Lack of employees | 4.7 | 5.5 | 4.4 | 3.4 | 2.3 | ‑1.1 | ‑2.4 | |
| Shortage of input materials | 3.0 | 2.6 | 4.0 | 5.5 | 5.9 | 0.4 | 2.9 | |
| Insufficient demand | 59.5 | 56.9 | 55.8 | 54.4 | 55.1 | 0.7 | ‑4.4 | |
| Production disruptions | 22.3 | 24.4 | 23.7 | 23.2 | 26.1 | 2.9 | 3.8 | |
| Other | 10.6 | 10.6 | 12.1 | 13.5 | 10.6 | ‑2.9 | 0.0 | |
The reasons that experienced the largest decrease in shares compared to the previous quarter was the category “other”, which decreased from 13.5 percent to 10.6 percent. The reason that primarily had the largest increase in shares compared to the previous quarter was production disruptions, which rose from 23.2 percent to 26.1 percent.
Statistics on reasons for lower capacity utilisation are available in the statistical database with a time period stretching back to the first quarter of 1998. The purpose of the statistics is to better explain changes in capacity utilisation. Please note that this part of the statistics is under development and may change.
Other information
Differences in Industrial Capacity Utilisation Levels
Statistics Sweden and The National Institute of Economic Research (NIER) have been publishing statistics on capacity utilisation in the manufacturing industry for about 30 years. The results from Statistics Swedens survey have consistently been at a higher level than those of NIER. A joint comparison between SCB and NIER has been made to explain the reason for this difference in levels. The full analysis can be read on the Statistics Sweden´s website Industrial capacity utilisation (scb.se) under the heading "More information".
Revisions
When capacity utilisation for a new quarter is published, the percentages for the previous quarter are also revised. Normally, the figures for the previous quarter are revised mainly due to new and revised information.
Next publishing will be
2025-08-21 at 08:00.
Statistical Database
More information is available in the Statistical Database
Feel free to use the facts from this statistical news but remember to state Source: Statistics Sweden.