Industrial capacity utilisation, second quarter 2025
Increased capacity utilisation in industry
Statistical news from Statistics Sweden 2025-08-21 8.00
Capacity utilisation in industry increased by 0.4 percentage points in the second quarter of 2025 compared with the first quarter of 2025 in seasonally adjusted figures.
The increase in capacity utilisation in industry in the second quarter led to an increase in the level of utilisation, which amounted to 88.5 percent in seasonally adjusted figures.
On an annual basis, capacity utilisation was unchanged compared with the second quarter of 2024 and amounted to 88.9 percent in calendar adjusted figures.
The figures for the second quarter of 2025 are preliminary. Since the previous publication capacity utilisation in the first quarter of 2025 has been revised upwards by 0.1 percentage points with the utilisation rate 88.1 percent, in seasonally adjusted figures.
In calendar adjusted figures capacity utilisation in the first quarter of 2025 has been revised upwards by 0.1 percentage points to a utilisation rate of 88.3 percent.
Please note that the publication of industrial capacity utilisation will cease after the release of data for the fourth quarter of 2025. For more information, see the section titled “Other Information.”
1) Calendar and seasonally adjusted figures 2) Calendar adjusted figures
Reasons for Lower Capacity Utilisation
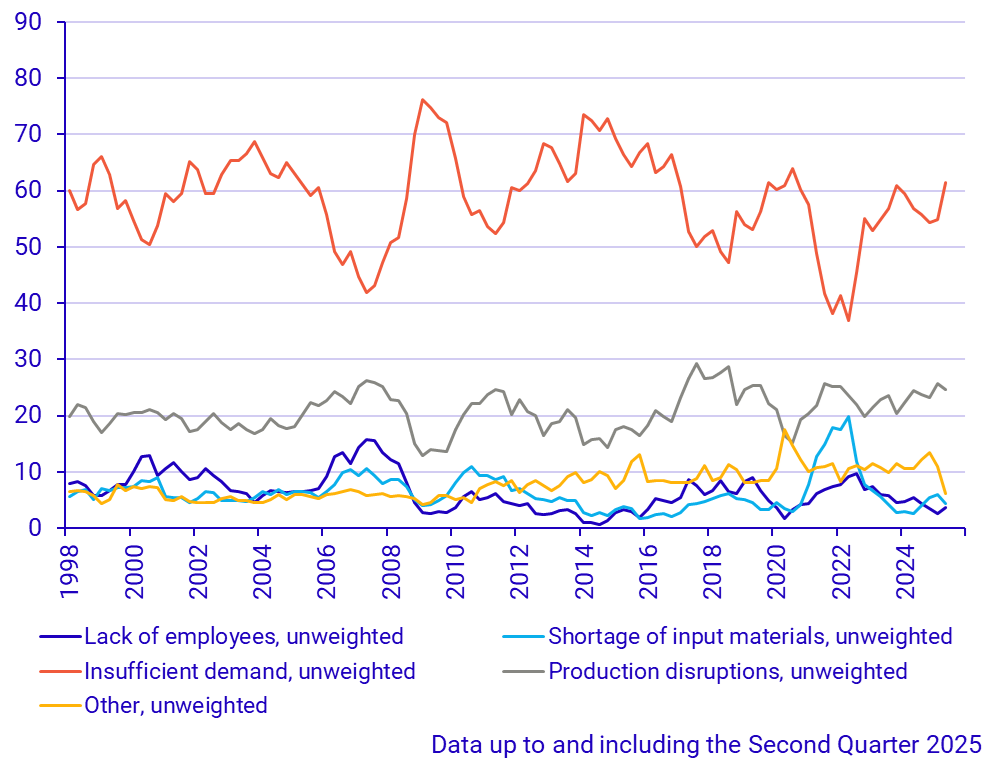
When businesses have a capacity utilisation rate of less than 100 percent, they must specify a primary reason for the lower capacity utilisation. The response options are fixed, and only one option can be selected. The shares of responses for each reason are distributed according to the diagram below. The responses are unweighted, unlike the capacity utilisation, which is weighted by industrial turnover.
| Reason for lower capacity utilization | Shares | |||||||
|---|---|---|---|---|---|---|---|---|
| 2024 | 2025 | Q2 2025-Q1 2025 | Q2 2025-Q2 2024 | |||||
| Q2 | Q3 | Q4 | Q1 | Q2 | ||||
| Lack of employees | 5.5 | 4.4 | 3.4 | 2.5 | 3.6 | 1.1 | ‑1.9 | |
| Shortage of input materials | 2.6 | 4.0 | 5.5 | 6.0 | 4.3 | ‑1.7 | 1.7 | |
| Insufficient demand | 56.9 | 55.8 | 54.4 | 54.9 | 61.4 | 6.5 | 4.5 | |
| Production disruptions | 24.4 | 23.7 | 23.2 | 25.7 | 24.6 | ‑1.1 | 0.2 | |
| Other | 10.6 | 12.1 | 13.5 | 11.0 | 6.1 | ‑4.9 | ‑4.5 | |
The reasons that experienced the largest decrease in shares compared to the previous quarter was the category “other”, which decreased from 11.0 percent to 6.1 percent. The reason that primarily had the largest increase in shares compared to the previous quarter was “lack of demand”, which rose from 54.9 percent to 61.4 percent.
Statistics on reasons for lower capacity utilisation are available in the statistical database with a time period stretching back to the first quarter of 1998. The purpose of the statistics is to better explain changes in capacity utilisation. Please note that this part of the statistics is under development and may change.
Other information
Discontinuation of Industrial Capacity Utilisation
The publication of industrial capacity utilisation will cease after the release of data for the fourth quarter of 2025, which will be published in February 2026.
The background to this decision is that, as of January 2025, the Business Tendency Survey is included in official statistics. This means that both Statistics Sweden’s and the National Institute of Economic Research’s (NIER) measures of capacity utilisation are now part of the official statistics. Statistics Sweden has assessed that it is not necessary to have two official measures of capacity utilisation, which has led to the decision to discontinue the survey.
The product page will remain available for at least one year to facilitate the transition and enable comparisons between the surveys conducted by NIER and Statistics Sweden. As support, there is also an in-depth article explaining the differences in capacity utilisation levels between the surveys. The article also includes a final table comparing the design of the two surveys. The full analysis can be read on the Statistics Sweden´s website Industrial capacity utilisation (scb.se) under the heading "Fördjupad information".
Differences in Industrial Capacity Utilisation Levels
Statistics Sweden and The National Institute of Economic Research (NIER) have been publishing statistics on capacity utilisation in the manufacturing industry for about 30 years. The results from Statistics Swedens survey have consistently been at a higher level than those of NIER. A joint comparison between SCB and NIER has been made to explain the reason for this difference in levels. The full analysis can be read (only in Swedish) on the Statistics Sweden´s website Industrial capacity utilisation (scb.se) under the heading "Fördjupad information".
Revisions
When capacity utilisation for a new quarter is published, the percentages for the previous quarter are also revised. Normally, the figures for the previous quarter are revised mainly due to new and revised information.
Next publishing will be
2025-11-21 at 08:00.
Statistical Database
More information is available in the Statistical Database
Feel free to use the facts from this statistical news but remember to state Source: Statistics Sweden.