Structural Business Statistics 2023
Large enterprises continue to dominate the Swedish business sector
Statistical news from Statistics Sweden 2025-05-14 8.00
Net turnover in the business sector amounted to SEK 12 457 billion in 2023, an increase of 4.2 percent compared to 2022. The largest enterprises, with more than 250 employees, contributed most to this increase.
“In terms of numbers, the Swedish business sector is dominated by enterprises with 0-9 employees, so-called micro enterprises, however, it is the largest enterprises that contribute the most to the total increase in net turnover in 2023”, says Hugo Lindblom, statistician at Statistics Sweden.
“When it comes to number of employees, it is those who already had employed more than 250 persons, that are increasing”, adds Mariah Nilsson, statistician at Statistics Sweden. Other size classes have reduced number of employees, but the increase in the largest size class contributes to the 1.1 percent increase in the entire business sector.
Structural business statistics is the only survey that is based on annual accounts from all non-financial enterprises in Sweden. Based on this data, a large number of statistics can be produced both for the entire business sector, as well as breakdowns by industry. Structural business statistics produces complete income statements and balance sheets, as well as breakdowns by size class and numerous key ratios.
Summary of Structural business statistics 2023
- The business sector consisted of just over 1 million enterprises
- Net turnover in the business sector amounted to SEK 12 457 billion, an increase of 4.2 percent compared to 2022
- Total assets amounted to SEK 21 734 billion, an increase of 5.5 percent
- In total, about 3 million persons were employed in the business sector
- The largest enterprises contributed with 53 percent of net turnover in the business sector, an increase of 1.7 percentages compared to 2022
- Number of employees decreased in all size classes except from the largest size class which increased with 5.2 percent
- Net margin was 7.2 percent and Return on Total Capital was 8.9 percent
- Profitability expressed as operating margin before depreciations was 8.7 percent
- Each employee contributed just over SEK 1 million to the value added of the business sector
- Value added increased by 3.5 percent, however, expressed in fixed prices, value added decreased by 1.6 percent
Size class
In 2023, the number of employees has decreased in all size classes except for the largest size class (more than 250 employees). Despite a decrease in the smaller size classes, there has been an increase in the total number of employees. The increase in 2023 was 34 000 persons. This increase is contributed to the largest enterprises which increases with almost 69 000 employees in 2023, and they had 5.2 percent more employees than in 2022.
The largest enterprises also add most to the increase of net turnover in the business sector 2023. These enterprises contribute with SEK 477 billion of the total increase of SEK 500 billion. This is an increase of 7.8 percent in net turnover for the largest enterprises. As a comparison, the smallest size class, the micro enterprises (0-9 employees), only had an increase of 1.8 percent or just over SEK 34 billion. The largest enterprises share of the total business sectors net turnover increased from 51.3 percent in 2022 to 53 percent in 2023, meanwhile the smallest enterprises share decreased from 15.6 percent in 2022 to 15.2 percent in 2023.

The largest enterprises are dominant when it comes to net turnover and number of employees in the total business sector, but there are some differences between industry sections.
Manufacturing, (NACE 10-33), is the largest industry section based on number of employees. It follows the structure of the total business sector and is dominated by the largest enterprises. Of all employees in the manufacturing industries, 63.1 percent, or about 347 000 persons, are employed by a large enterprise. The largest enterprises contributed with SEK 2 595 billion to net turnover, which is 78.5 percent of the manufacturing industries.
In contrast to the manufacturing industries, the industry section for Agriculture, forestry and fishing (NACE 01-03), is dominated by micro enterprises, who contributes 70 percent of net turnover, and 58,9 percent of all employees. It is the enterprises in the smaller size classes with 10-19, and 20-49 employees, that contribute the most percentage to the increase of net turnover within the industries, with 15.4 and 21.6 percent respectively.
The industry section for Arts, entertainment and recreation (NACE 90-93) are also dominated by micro enterprises although the largest enterprises almost is at the same size. Respectively, they have 29 and 26.2 percent of number of employees in the industry. Number of employees decreased by 3 percent for the micro enterprises while the largest enterprises increased by 4 percent. Within the industries for Accommodation (NACE 55) and Food and beverage service activities (NACE 56), the distribution of both net turnover and number of employees is relatively equal between the largest and the micro enterprises. However, there has been a marginal decline of both number of employees and net turnover for the micro enterprises. The largest enterprises on the other hand, has had a large increase of both net turnover and number of employees in 2023, of 17.1 and 15.6 percent respectively.
Key ratios
Several key ratios can be calculated based on the enterprise unit in Structural business statistics.
The net margin in the business sector was 7.2 percent in 2023, which is a small decrease from 7.7 percent in 2022. Return on total capital amounted to 8.9 percent, an increase of 1 percentage compared to 2022. Working capital decreased by 2.7 percentages to 12.5 percent in 2023.
| Net margin | Return on Total Capital | Working Capital | |||||
|---|---|---|---|---|---|---|---|
| 2022 | 2023 | 2022 | 2023 | 2022 | 2023 | ||
| 21 | 6.4 | 27.0 | 6.1 | 16.3 | 18.3 | 22.4 | |
| 68 | 15.4 | ‑12.4 | 5.2 | 5.6 | ‑44.3 | ‑68.9 | |
| 72 | ‑19.5 | ‑9.7 | ‑4.1 | 0.5 | 65.9 | 49.8 | |
| Business sector (NACE 01-96 excl. 64-66, 84) | 7.7 | 7.2 | 7.9 | 8.9 | 15.2 | 12.5 | |
Broken down by industries, it is only the enterprises within NACE 72, Scientific activities, and NACE 68, Real estate activities, that displays a negative net margin. NACE 72 is a cost-intensive industry where a high working capital indicates good coverage for current liabilities and thus room for expansion despite the negative net margin and low return on total capital. For enterprises within real estate, net margin has decreased significantly compared to 2022. This may be due to a high loan-to-value ratio, which has resulted in high interest costs, which is also reflected in a reduced, but still high, working capital.
The opposite is true for NACE 21, Pharmaceuticals, where net margin increased from 6.4 percent in 2022 to 27 percent in 2023. Return on total capital and working capital in percentages of net turnover both increased compared to 2022. This industry thus shows a strong position for continued development and increased growth.
Profitability and volume development
Profitability in the business sector can be measured in numerous ways. The key ratios highlighted here for kind-of-activity unit is Operating margin before depreciations, and value added per employee.
Operating margin before depreciations for the business sector amounted in 2023 to 8.7 percent and has been relatively stable around 9 percent during the entire time series in the figure below. This margin shows that the business sector has received SEK 0.08 per SEK earned before depreciations, financial items and tax. A negative operating margin indicates thus that the operations has made a loss.
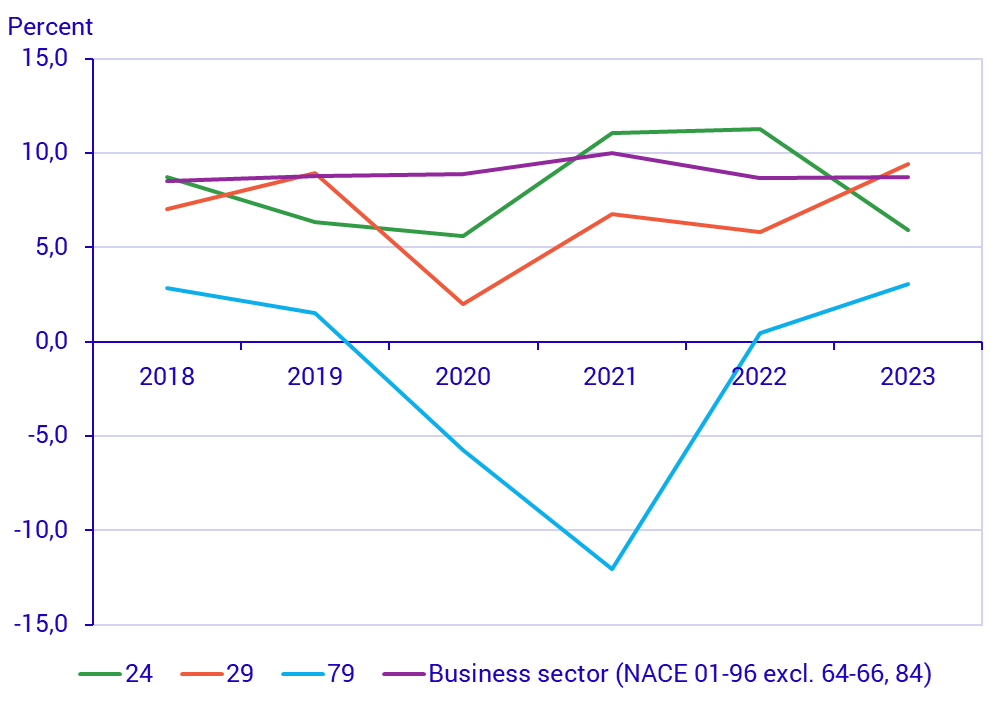
For the selected industries in the figure above, operating margin has varied more than for the business sector. NACE 24, Basic metals, and NACE 29, Motor vehicles, are traditional Swedish manufacturing industries, where operating margin for NACE 24 has returned to the same level in 2023 as previously in the time series at around 6 percent, while NACE 29 has had an even more varied time series and lands at 9.4 percent in 2023. Travel agents in NACE 79, have seen the operating margin returning to the level around 3 percent in 2023 which they had before the Corona pandemic in 2020-2021.
Another way of measuring profitability, or how productive the operations is, is to measure value added per employee, i.e. how much each employee contributes to the operations’ added value to cover for wages and salaries, depreciations, financial costs and tax. Value added in the business sector, for kind-of-activity unit, amounted to SEK 3 390 billion in 2023, where each employee contributed with SEK 1.1 million.
| 2018 | 2019 | 2020 | 2021 | 2022 | 2023 | |
|---|---|---|---|---|---|---|
| 24 | 1 158 | 1 096 | 989 | 1 404 | 1 574 | 1 249 |
| 29 | 1 167 | 1 214 | 849 | 1 178 | 1 200 | 1 692 |
| 79 | 763 | 688 | 179 | 76 | 609 | 903 |
| Business sector (NACE 01-96 excl. 64-66, 84) | 902 | 941 | 940 | 1 026 | 1 088 | 1 115 |
For both the business sector and the selected industries in the time series above, it is evident that operating margin and value added per employee are correlated.
By calculating production value and consumption value in both current and fixed prices, it is possible to compare development figures to see whether an increase in value added is due to an increased sales volume or if it is also affected by price changes. In 2023 production value increased by 5.2 percent, consumption value by 6.2 percent and value added by 3.5 percent expressed in current prices compared to 2022.
If these development figures are put in relation to the price increases it is noticeable that a large part of the increases can be attributed to increased prices, and not to an increased sales volume. When the production, consumption, and value added of 2023 is expressed in 2022 prices, i.e. adjusted for the large price increases in 2023, production value increased by 1.2 percent and consumption value by 2.8 percent. Value added thus decreased by 1.6 percent.
Definitions and explanations
All information in this item of statistical news is reported in current prices unless otherwise stated. All comparisons have been made with final data for 2022.
Net turnover: Net turnover excluding excise taxes and merchanting.
Value added: Actual production minus costs for purchased goods and services, except salaries, payroll taxes and the costs of goods for resale (because only the trade margin for these is included in the production value). Value added can also be referred to as the contribution to GDP (gross domestic product).
Production value: Actual production or output of enterprises during the year. Based on sales, i.e., net turnover, adjusted for changes in inventory and work in progress, capitalized work on own account, other operating income excluding grants, capital gains and the purchase cost of goods for resale (because only the trade margin is included).
Consumption value: Actual consumption used by enterprises during the year. Based on costs of purchased goods and services used as inputs in production, but does not include wages, social security contributions and the purchase of goods for resale.
Employees: Average number of employees, full-time equivalents: two half-time employees are counted as one full-time employee.
Size class: Size class divided data is calculated based on full-time equivalents, 0-9, 10-19, 20-49, 50-249, 250+.
Net margin: Net margin is the same as operating profit/loss after financial items in relation to net turnover.
Return on total capital: Calculated by operating profit/loss after depreciations plus financial income as a percentage of sum of equity and liabilities.
Working capital: Working capital in relation to net turnover is calculated by total current assets minus current liabilities as a percentage of net turnover.
Operating margin: Operating margin before depreciations in relation to net turnover. For the years 2022 and 2023, this key ratio is calculated excluding income/costs from the operations’ merchanting/foreign production. For the years 2018-2021, this is included in the key ratio.
Business sector: Enterprises conducting business activities in Sweden regardless of legal form. Businesses with financial activities and housing cooperatives are not included in the Structural Business Statistics. Public administration activities are also not included.
NACE Rev. 2: Industrial classification for classifying enterprises into industries according to the activity they conduct. The Swedish equivalent is SNI2007 (Svensk näringsgrensindelning).
Information on the quality of the statistics, production methods, frequently requested tables, charts, and more is available on the Statistics Sweden website under Structural business statistics (scb.se).
Next publishing will be
The next item of statistical news in this series is scheduled for publication in May 2026.
Statistical Database
More information is available in the Statistical Database
Feel free to use the facts from this statistical news but remember to state Source: Statistics Sweden.