Exports and imports of goods, quarter 3 2024/January-September 2024, in current prices and in constant prices
Weak trade in goods in the third quarter
Statistical news from Statistics Sweden 2024-11-28 8.00
In the third quarter 2024, both exports and imports of goods decreased by 3 percent in value while they remained the same in volume compared with the same period a year ago.
- In the first nine months of 2024, imports from Norway decreased by 10 percent which amounted to about SEK 16 billion. Imports of crude petroleum oils accounted for the largest decrease, says Maria Adolfsson, statistician at Statistics Sweden.
Summary
- In the third quarter of 2024, Swedish exports and imports of goods decreased by 3 percent in value (in current prices), while in terms of volume (in constant prices) they remained the same, compared with the same period a year ago.
- Compared with the previous quarter, Swedish exports of goods decreased by 11 percent in value and by 9 percent in volume. Imports of goods fell by 7 percent in value and by 5 percent in volume.
- In the period January–September 2024, the value of Swedish exports of goods amounted to SEK 1 532 billion, a decrease of 1 percent compared with the same period a year ago. At the same time, the value of imports of goods decreased by 3 percent and amounted to SEK 1 480 billion.
- In the period January–September 2024, exports of goods decreased by 1 percent and imports of goods decreased by 2 percent in volume.
- Net trade shows a surplus of SEK 52 billion in the period January–September 2024. In the same period in 2023, there was a net trade surplus of SEK 27 billion.
Detailed information about the third quarter 2024 (in current prices and in constant prices)
Exports of mineral fuels and electric current decreased by 22 percent in value and by 10 percent in volume
Exports of machinery and transport equipment decreased by 1 percent in value, while they increased by 1 percent in volume. Exports of wood and paper products rose by 4 percent in value, and by 6 percent in volume. Exports of minerals increased by 1 percent in value, and by 2 percent in volume. Exports of mineral fuels and electric current decreased by 22 percent in value, and by 10 percent in volume. Within the other products area, exports of food/beverages/tobacco fell by 4 percent in value, and by 1 percent in volume.
| Exports | ||||||||
|---|---|---|---|---|---|---|---|---|
| Value (current prices) | Value (current prices) | Volume (value in constant prices) | Value (current prices) | Volume (value in constant prices) | ||||
| Share in % | Change in % | Change in % | Change in % | Change in % | ||||
| Commodity group according to SITC | January-September 2024 | January-September 2023 | January-September 2024 | Q1-3 2024/Q1-3 2023 | Q1-3 2024/Q1-3 2023 | Q3 2024/Q3 2023 | Q3 2024/Q3 2023 | |
| Total | 1 532 286 | 1 552 094 | 100.0 | ‑1 | ‑1 | ‑3 | 0 | |
| Wood and paper products | 139 708 | 141 334 | 9.1 | ‑1 | 5 | 4 | 6 | |
| Wood | 32 440 | 32 328 | 2.1 | 0 | ‑3 | 11 | 6 | |
| Pulp and waste paper | 22 556 | 25 620 | 1.5 | ‑12 | ‑13 | ‑10 | ‑25 | |
| Paper, paper products | 78 722 | 77 304 | 5.1 | 2 | 15 | 6 | 15 | |
| Minerals | 156 955 | 160 953 | 10.2 | ‑2 | ‑1 | 1 | 2 | |
| Iron ore and concentrates | 19 441 | 25 525 | 1.3 | ‑24 | ‑23 | ‑6 | ‑1 | |
| Iron and steel | 60 585 | 68 757 | 4.0 | ‑12 | ‑5 | ‑4 | 4 | |
| Non-ferrous metals | 43 905 | 34 479 | 2.9 | 27 | 24 | 9 | 3 | |
| Chemicals, rubber products | 234 380 | 233 859 | 15.3 | 0 | 0 | ‑2 | ‑1 | |
| Organic/inorganic chemicals | 22 355 | 23 592 | 1.5 | ‑5 | 3 | 12 | 19 | |
| Pharmaceutical products | 114 001 | 114 430 | 7.4 | 0 | ‑2 | ‑10 | ‑10 | |
| Plastics | 38 150 | 35 710 | 2.5 | 7 | 9 | 8 | 7 | |
| Mineral fuels, electric current | 113 926 | 127 483 | 7.4 | ‑11 | ‑4 | ‑22 | ‑10 | |
| Petroleum products | 102 344 | 105 508 | 6.7 | ‑3 | 3 | ‑18 | ‑2 | |
| Machinery, transport equipment | 683 261 | 679 246 | 44.6 | 1 | ‑1 | ‑1 | 1 | |
| Manufactures of metals | 37 940 | 37 916 | 2.5 | 0 | ‑1 | 2 | 1 | |
| Industrial machinery | 220 113 | 223 040 | 14.4 | ‑1 | ‑5 | ‑3 | ‑4 | |
| Electronics, telecommunication | 157 897 | 151 190 | 10.3 | 4 | 7 | 8 | 14 | |
| Road vehicles | 221 385 | 225 584 | 14.4 | ‑2 | ‑4 | ‑12 | ‑11 | |
| Passenger cars | 121 178 | 118 870 | 7.9 | 2 | 1 | ‑9 | ‑7 | |
| Lorries, trucks[1] | 33 979 | 36 887 | 2.2 | ‑8 | ‑14 | ‑15 | ‑16 | |
| Parts, accessories | 52 088 | 53 874 | 3.4 | ‑3 | ‑4 | ‑14 | ‑12 | |
| Other transport equipment | 11 399 | 7 657 | 0.7 | 49 | 51 | 226 | 242 | |
| Instruments, photo/optical products | 34 528 | 33 859 | 2.3 | 2 | ‑1 | 1 | 1 | |
| Other products | 204 057 | 209 220 | 13.3 | ‑2 | ‑3 | ‑3 | 0 | |
| Food, beverages, tobacco | 102 316 | 105 178 | 6.7 | ‑3 | ‑3 | ‑4 | ‑1 | |
| Textiles, clothing, footwear | 38 726 | 40 167 | 2.5 | ‑4 | ‑5 | ‑4 | ‑2 | |
| Furniture | 16 940 | 17 586 | 1.1 | ‑4 | ‑4 | ‑4 | ‑1 | |
Imports of pharmaceutical products increased by 19 percent in value and by 20 percent in volume
Imports of machinery and transport equipment decreased by 7 percent in value, and by 6 percent in volume. Imports of wood and paper products rose by 10 percent in value, and by 8 percent in volume. Imports of minerals increased by 1 percent in value, and by 5 percent in volume. Imports of chemicals and rubber products rose by 8 percent in both value and volume. Within this product area, imports of pharmaceutical products increased by 19 percent in value, and by 20 percent in volume. Imports of mineral fuels and electric current fell by 12 percent in value, while they rose by 1 percent in volume. Within the other products area, imports of food/beverages/tobacco decreased by 1 percent in value, while they increased by 2 percent in volume.
| Imports | ||||||||
|---|---|---|---|---|---|---|---|---|
| Value (current prices) | Value (current prices) | Volume (value in constant prices) | Value (current prices) | Volume (value in constant prices) | ||||
| Share in % | Change in % | Change in % | Change in % | Change in % | ||||
| Commodity group according to SITC | January-September 2024 | January-September 2023 | January-September 2024 | Q1-3 2024/Q1-3 2023 | Q1-3 2024/Q1-3 2023 | Q3 2024/Q3 2023 | Q3 2024/Q3 2023 | |
| Total | 1 479 508 | 1 525 230 | 100.0 | ‑3 | ‑2 | ‑3 | 0 | |
| Wood and paper products | 41 232 | 40 017 | 2.8 | 3 | 8 | 10 | 8 | |
| Minerals | 119 321 | 120 703 | 8.1 | ‑1 | 4 | 1 | 5 | |
| Iron and steel | 42 926 | 50 010 | 2.9 | ‑14 | ‑3 | ‑6 | 6 | |
| Non-ferrous metals | 32 815 | 27 783 | 2.2 | 18 | 24 | ‑2 | 0 | |
| Metalliferous ores, metal scrap | 22 849 | 20 244 | 1.5 | 13 | 6 | 38 | 27 | |
| Chemicals, rubber products | 198 584 | 197 005 | 13.4 | 1 | 2 | 8 | 8 | |
| Organic/inorganic chemicals | 41 275 | 45 908 | 2.8 | ‑10 | ‑12 | 6 | 0 | |
| Pharmaceutical products | 60 218 | 52 529 | 4.1 | 15 | 16 | 19 | 20 | |
| Plastics | 32 616 | 33 043 | 2.2 | ‑1 | 3 | 5 | 6 | |
| Crude rubber, rubber products | 15 874 | 16 632 | 1.1 | ‑5 | ‑5 | ‑4 | ‑6 | |
| Mineral fuels, electric current | 156 717 | 170 480 | 10.6 | ‑8 | ‑4 | ‑12 | 1 | |
| Crude petroleum oils | 92 701 | 87 754 | 6.3 | 6 | 3 | ‑7 | 1 | |
| Petroleum products | 49 588 | 63 968 | 3.4 | ‑22 | ‑13 | ‑19 | 4 | |
| Machinery, transport equipment | 644 247 | 675 021 | 43.5 | ‑5 | ‑5 | ‑7 | ‑6 | |
| Manufactures of metals | 44 882 | 47 960 | 3.0 | ‑6 | ‑3 | ‑5 | 0 | |
| Industrial machinery | 155 475 | 160 194 | 10.5 | ‑3 | ‑7 | ‑2 | ‑4 | |
| Electronics, telecommunication | 235 447 | 241 484 | 15.9 | ‑2 | 0 | ‑10 | ‑6 | |
| Road vehicles | 155 723 | 176 685 | 10.5 | ‑12 | ‑13 | ‑11 | ‑11 | |
| Passenger cars | 78 574 | 90 891 | 5.3 | ‑14 | ‑14 | ‑6 | ‑6 | |
| Parts and accessories | 50 653 | 52 498 | 3.4 | ‑4 | ‑5 | ‑7 | ‑6 | |
| Other transport equipment | 15 345 | 11 822 | 1.0 | 30 | 29 | 22 | 23 | |
| Instruments, photo/optical equip | 37 375 | 36 875 | 2.5 | 1 | ‑3 | 1 | ‑2 | |
| Other products | 319 406 | 322 004 | 21.6 | ‑1 | 0 | 2 | 4 | |
| Food, beverages, tobacco | 168 503 | 169 591 | 11.4 | ‑1 | 2 | ‑1 | 2 | |
| Textiles, clothing, footwear | 70 293 | 69 997 | 4.8 | 0 | 0 | 7 | 8 | |
| Furniture | 19 641 | 20 048 | 1.3 | ‑2 | ‑5 | 5 | 3 | |
Value and volume trends
The value index and the volume index describe nominal and real value trends over time. The real value trends describe trends in which price changes have been removed. The indices are chain indices with base year 2015=100.
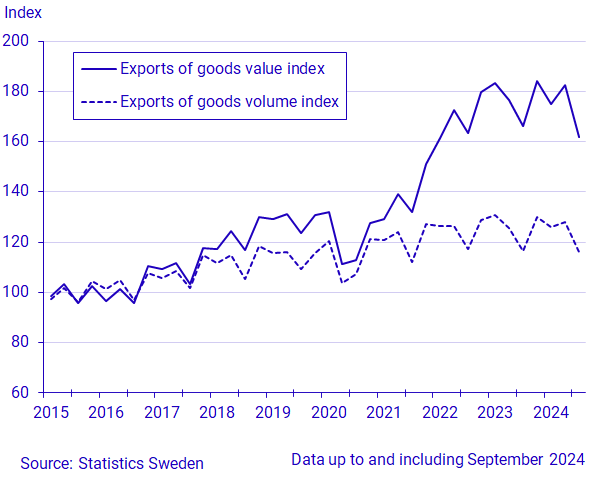
The value index and the volume index for exports of goods decreased in the third quarter compared with the second quarter. The value index is lower while the volume index remained the same compared with the same period last year.
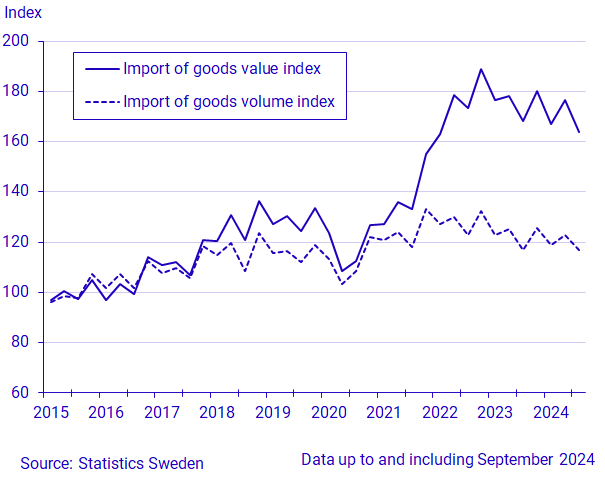
The value index and the volume index for imports of goods decreased in the third quarter compared with the second quarter. The value index is lower while the volume index remained the same compared with the same period last year.
Detailed information about January–September 2024 (current prices)
Imports of goods from Norway fell by 10 percent
Both Sweden’s exports of goods to and imports of goods from EU27 decreased by 4 percent compared with the same period a year ago. Exports to euro countries fell by 4 percent and imports from there by 5 percent. Among the EU countries, exports to Germany decreased by 6 percent, to Denmark by 8 percent and to Finland by 4 percent. Imports from Germany fell by 5 percent, while imports from Denmark remained the same. Imports from Finland rose by 2 percent.
Exports to other European countries increased by 1 percent, while imports from there decreased by 6 percent. Exports to the United Kingdom fell by 5 percent, while imports from there rose by 2 percent. Exports to Norway increased by 3 percent, while imports from there fell by 10 percent. In the period, imports of crude petroleum oils accounted for the largest decrease from Norway. Exports to Russia rose by 4 percent, and imports from there by 32 percent.
Exports to Asia rose by 5 percent, and imports from there by 1 percent. Exports to China increased by 5 percent, and imports from there by 2 percent.
Both exports to and imports from the United States decreased by 2 percent.
| Exports | Imports | ||||||||
|---|---|---|---|---|---|---|---|---|---|
| Value (current prices) | Value (current prices) | ||||||||
| Region | January-September | Share in % | Change in % | January-September | Share in % | Change in % | |||
| 2024 | 2023 | 2024 | 2024/2023 | 2024 | 2023 | 2024 | 2024/2023 | ||
| Total | 1 532 286 | 1 552 094 | 100.0 | ‑1 | 1 479 508 | 1 525 230 | 100.0 | ‑3 | |
| Europe | 1 108 844 | 1 140 530 | 72.4 | ‑3 | 1 222 463 | 1 278 667 | 82.6 | ‑4 | |
| EU27_2020 | 826 466 | 859 844 | 53.9 | ‑4 | 984 023 | 1 024 661 | 66.5 | ‑4 | |
| EMU-20 | 633 073 | 656 285 | 41.3 | ‑4 | 769 622 | 809 925 | 52.0 | ‑5 | |
| Other European countries | 282 378 | 280 686 | 18.4 | 1 | 238 439 | 254 006 | 16.1 | ‑6 | |
| Africa | 29 942 | 27 246 | 2.0 | 10 | 19 553 | 14 185 | 1.3 | 38 | |
| North Africa | 15 440 | 12 564 | 1.0 | 23 | 7 618 | 5 112 | 0.5 | 49 | |
| West Africa | 2 271 | 3 243 | 0.1 | ‑30 | 10 002 | 5 632 | 0.7 | 78 | |
| Central, East and Southern Africa | 12 232 | 11 439 | 0.8 | 7 | 1 934 | 3 442 | 0.1 | ‑44 | |
| America | 194 532 | 193 971 | 12.7 | 0 | 77 454 | 71 010 | 5.2 | 9 | |
| North America | 161 880 | 161 342 | 10.6 | 0 | 57 499 | 58 396 | 3.9 | ‑2 | |
| Central and South America | 32 652 | 32 628 | 2.1 | 0 | 19 955 | 12 614 | 1.3 | 58 | |
| Asia | 176 541 | 167 483 | 11.5 | 5 | 155 645 | 153 986 | 10.5 | 1 | |
| Middle- and Near East | 33 449 | 27 399 | 2.2 | 22 | 11 181 | 7 990 | 0.8 | 40 | |
| Other countries in Asia | 143 093 | 140 084 | 9.3 | 2 | 144 464 | 145 995 | 9.8 | ‑1 | |
| Oceania and Antarctica | 16 904 | 16 021 | 1.1 | 6 | 4 392 | 7 339 | 0.3 | ‑40 | |
Exports of mineral fuels and electric current fell by 11 percent
Exports of machinery and transport equipment increased by 1 percent, while exports of wood and paper products fell by 1 percent. Exports of chemicals and rubber products remained the same, while exports of mineral fuels and electric current fell by 11 percent. Exports of minerals decreased by 2 percent. Within this product area, exports of iron ore and concentrates decreased by 24 percent. Within the other products area, exports of food/beverages/tobacco decreased by 3 percent.
Imports of road vehicles decreased by 12 percent
Imports of machinery and transport equipment decreased by 5 percent. Within this product area, imports of road vehicles fell by 12 percent. Imports of wood and paper products rose by 3 percent, while imports of minerals decreased by 1 percent. Imports of mineral fuels and electric current fell by 8 percent. Within this product area, imports of petroleum products decreased by 22 percent. Within the other products area, imports of food/beverages/tobacco fell by 1 percent.
Definitions and explanations
The value index and the volume index describe nominal and real value trends over time. The real value trends describe trends in which price changes have been removed. The indices refer to chain indices with base year 2015=100.
Next publishing will be
The next item of statistical news in this series will be published on 2025-02-27.
Statistical Database
More information is available in the Statistical Database
Feel free to use the facts from this statistical news but remember to state Source: Statistics Sweden.