Exports and imports of goods, quarter 3 2025/January-September 2025, in current prices and in constant prices
Weaker exports of goods in terms of value in the third quarter
Statistical news from Statistics Sweden 2025-11-27 8.00
In the third quarter of 2025, exports of goods decreased by 1 percent in value, while they increased by 4 percent in volume compared with the same period a year ago. At the same time, imports of goods fell by 1 percent in value, while they rose by 3 percent in volume.
– Imports of food/beverages/tobacco rose by 7 percent in value in the third quarter, which amounted to about SEK 9.5 billion, says Maria Adolfsson, statistician at Statistics Sweden.
Summary
- In the third quarter of 2025, Swedish exports of goods decreased by 1 percent in value (in current prices), while they rose by 4 percent in terms of volume (in constant prices), compared with the same period a year ago. Imports of goods decreased by 1 percent in value, while they increased by 3 percent in terms of volume.
- Compared with the previous quarter, Swedish exports of goods decreased by 8 percent in value and by 7 percent in volume. Imports of goods fell by 4 percent in both value and volume.
- In the period January–September 2025, the value of Swedish exports of goods decreased by 1 percent and amounted to SEK 1 526 billion, compared with the same period a year ago. At the same time, the value of imports of goods decreased by 1 percent and amounted to SEK 1 470 billion.
- In the period January–September 2025, exports of goods increased by 4 percent in volume and imports of goods rose by 2 percent.
- Net trade shows a surplus of SEK 56 billion in the period January–September 2025. In the same period in 2024, there was a net trade surplus of SEK 55 billion.
Detailed information about the third quarter 2025 (in current prices and in constant prices)
Exports of passenger cars fell by 16 percent in value and by 10 percent in volume
Exports of machinery/transport equipment decreased by 2 percent in value in the third quarter, while they increased by 3 percent in volume, compared with the same period a year ago. Within this product area, exports of passenger cars fell by 16 percent in value and by 10 percent in volume. Exports of wood and paper products fell by 4 percent in value, and by 2 percent in volume. Exports of minerals increased by 1 percent in value, and by 7 percent in volume. Exports of chemicals/rubber products fell by 2 percent in value, while they rose by 6 percent in volume. Exports of mineral fuels/electric current decreased by 9 percent in value, while they increased by 4 percent in volume. The difference between value and volume development is due to lower prices for petroleum products. Within the other products area, exports of food/beverages/tobacco increased by 7 percent in value, and by 9 percent in volume.
| Exports | ||||||||
|---|---|---|---|---|---|---|---|---|
| Value (current prices, SEK million) | Value (current prices) | Volume (value in constant prices) | Value (current prices) | Volume (value in constant prices) | ||||
| Share in % | Change in % | Change in % | Change in % | Change in % | ||||
| Commodity group according to SITC | January-September 2025 | January-September 2024 | January-September 2025 | Q1-3 2025/Q1-3 2024 | Q1-3 2025/Q1-3 2024 | Q3 2025/Q3 2024 | Q3 2025/Q3 2024 | |
| Total | 1 525 743 | 1 538 102 | 100.0 | ‑1 | 4 | ‑1 | 4 | |
| Wood and paper products | 138 949 | 139 575 | 9.1 | 0 | ‑3 | ‑4 | ‑2 | |
| Wood | 35 905 | 32 432 | 2.4 | 11 | ‑1 | 6 | ‑3 | |
| Pulp and waste paper | 21 690 | 22 570 | 1.4 | ‑4 | 1 | ‑6 | 15 | |
| Paper, paper products | 75 308 | 78 608 | 4.9 | ‑4 | ‑5 | ‑8 | ‑6 | |
| Minerals | 162 508 | 156 775 | 10.7 | 4 | 8 | 1 | 7 | |
| Iron ore and concentrates | 20 476 | 19 412 | 1.3 | 5 | 22 | ‑15 | ‑1 | |
| Iron and steel | 57 311 | 60 545 | 3.8 | ‑5 | 3 | ‑10 | ‑1 | |
| Non-ferrous metals | 49 746 | 43 855 | 3.3 | 13 | 14 | 25 | 28 | |
| Chemicals, rubber products | 236 082 | 234 466 | 15.5 | 1 | 5 | ‑2 | 6 | |
| Organic/inorganic chemicals | 22 120 | 22 297 | 1.4 | ‑1 | 7 | ‑3 | 8 | |
| Pharmaceutical products | 112 049 | 114 031 | 7.3 | ‑2 | 3 | ‑3 | 7 | |
| Plastics | 40 096 | 38 095 | 2.6 | 5 | 10 | 0 | 8 | |
| Mineral fuels, electric current | 106 599 | 120 780 | 7.0 | ‑12 | 4 | ‑9 | 4 | |
| Petroleum products | 86 732 | 102 213 | 5.7 | ‑15 | 0 | ‑13 | 3 | |
| Machinery, transport equipment | 662 693 | 683 242 | 43.4 | ‑3 | 2 | ‑2 | 3 | |
| Manufactures of metals | 37 688 | 37 823 | 2.5 | 0 | 2 | ‑1 | 3 | |
| Industrial machinery | 218 576 | 220 200 | 14.3 | ‑1 | 2 | ‑1 | 3 | |
| Electronics, telecommunication | 160 154 | 157 133 | 10.5 | 2 | 13 | ‑1 | 10 | |
| Road vehicles | 193 627 | 220 749 | 12.7 | ‑12 | ‑10 | ‑6 | ‑3 | |
| Passenger cars | 98 446 | 120 693 | 6.5 | ‑18 | ‑15 | ‑16 | ‑10 | |
| Lorries, trucks[1] | 32 703 | 34 009 | 2.1 | ‑4 | 1 | 6 | 14 | |
| Parts, accessories | 49 935 | 52 034 | 3.3 | ‑4 | ‑5 | 7 | 5 | |
| Other transport equipment | 16 026 | 12 480 | 1.1 | 28 | 38 | 4 | 10 | |
| Instruments, photo/optical products | 36 621 | 34 858 | 2.4 | 5 | 10 | ‑2 | 3 | |
| Other products | 218 911 | 203 265 | 14.3 | 8 | 10 | 8 | 10 | |
| Food, beverages, tobacco | 109 274 | 102 338 | 7.2 | 7 | 9 | 7 | 9 | |
| Textiles, clothing, footwear | 40 746 | 38 366 | 2.7 | 6 | 10 | 12 | 17 | |
| Furniture | 16 719 | 16 881 | 1.1 | ‑1 | ‑4 | ‑1 | ‑3 | |
Imports of mineral fuels/electric current fell by 21 percent in value and by 2 percent in volume
Imports of machinery/transport equipment increased by 2 percent in value and by 5 percent in volume in the third quarter, compared with the same period a year ago. Within this product area imports of passenger cars fell by 6 percent in value, and by 5 percent in volume. Imports of wood and paper products decreased by 5 percent in value and by 2 percent in volume. Imports of minerals decreased by 3 percent in value, while they increased by 2 percent in volume. Imports of chemicals/rubber products decreased by 3 percent in value, while they remained the same in volume. Imports of mineral fuels/electric current fell by 21 percent in value and by 2 percent in volume. The difference between value and volume development is due to lower prices for petroleum products. Within the other products area, imports of food/beverages/tobacco increased by 7 percent in both value and volume.
| Imports | ||||||||
|---|---|---|---|---|---|---|---|---|
| Value (current prices, SEK million) | Value (current prices) | Volume (value in constant prices) | Value (current prices) | Volume (value in constant prices) | ||||
| Share in % | Change in % | Change in % | Change in % | Change in % | ||||
| Commodity group according to SITC | January-September 2025 | January-September 2024 | January-September 2025 | Q1-3 2025/Q1-3 2024 | Q1-3 2025/Q1-3 2024 | Q3 2025/Q3 2024 | Q3 2025/Q3 2024 | |
| Total | 1 470 000 | 1 482 624 | 100.0 | ‑1 | 2 | ‑1 | 3 | |
| Wood and paper products | 40 644 | 40 852 | 2.8 | ‑1 | ‑1 | ‑5 | ‑2 | |
| Minerals | 116 742 | 119 393 | 7.9 | ‑2 | 2 | ‑3 | 2 | |
| Iron and steel | 39 768 | 43 041 | 2.7 | ‑8 | 1 | ‑11 | ‑3 | |
| Non-ferrous metals | 30 640 | 32 897 | 2.1 | ‑7 | ‑6 | ‑5 | 0 | |
| Metalliferous ores, metal scrap | 24 787 | 22 850 | 1.7 | 8 | 10 | 4 | 9 | |
| Chemicals, rubber products | 197 552 | 200 711 | 13.4 | ‑2 | 0 | ‑3 | 0 | |
| Organic/inorganic chemicals | 37 928 | 42 985 | 2.6 | ‑12 | ‑7 | ‑10 | ‑3 | |
| Pharmaceutical products | 63 227 | 60 788 | 4.3 | 4 | 3 | 5 | 4 | |
| Plastics | 31 799 | 32 605 | 2.2 | ‑2 | 1 | ‑8 | ‑2 | |
| Crude rubber, rubber products | 15 881 | 15 890 | 1.1 | 0 | ‑4 | 2 | 1 | |
| Mineral fuels, electric current | 127 869 | 158 480 | 8.7 | ‑19 | ‑1 | ‑21 | ‑2 | |
| Crude petroleum oils | 72 048 | 92 362 | 4.9 | ‑22 | ‑2 | ‑22 | 1 | |
| Petroleum products | 42 631 | 50 375 | 2.9 | ‑15 | 2 | ‑18 | ‑6 | |
| Machinery, transport equipment | 650 344 | 643 869 | 44.2 | 1 | 3 | 2 | 5 | |
| Manufactures of metals | 46 913 | 45 141 | 3.2 | 4 | 5 | 1 | 3 | |
| Industrial machinery | 149 557 | 156 499 | 10.2 | ‑4 | ‑3 | ‑6 | ‑3 | |
| Electronics, telecommunication | 231 043 | 235 560 | 15.7 | ‑2 | 2 | 1 | 6 | |
| Road vehicles | 162 364 | 155 870 | 11.0 | 4 | 3 | 2 | 1 | |
| Passenger cars | 81 768 | 78 400 | 5.6 | 4 | 5 | ‑6 | ‑5 | |
| Parts and accessories | 49 921 | 50 718 | 3.4 | ‑2 | ‑7 | 4 | ‑1 | |
| Other transport equipment | 22 242 | 13 592 | 1.5 | 64 | 61 | 132 | 132 | |
| Instruments, photo/optical equip | 38 224 | 37 208 | 2.6 | 3 | 3 | 3 | 4 | |
| Other products | 336 850 | 319 319 | 22.9 | 5 | 6 | 4 | 5 | |
| Food, beverages, tobacco | 178 234 | 168 722 | 12.1 | 6 | 6 | 7 | 7 | |
| Textiles, clothing, footwear | 72 189 | 70 144 | 4.9 | 3 | 1 | ‑1 | ‑3 | |
| Furniture | 19 988 | 19 576 | 1.4 | 2 | 6 | ‑5 | 2 | |
Value and volume trends
The value index and the volume index describe nominal and real value trends over time. The real value trends describe trends in which price changes have been removed. The indices are chain indices with base year 2015=100.
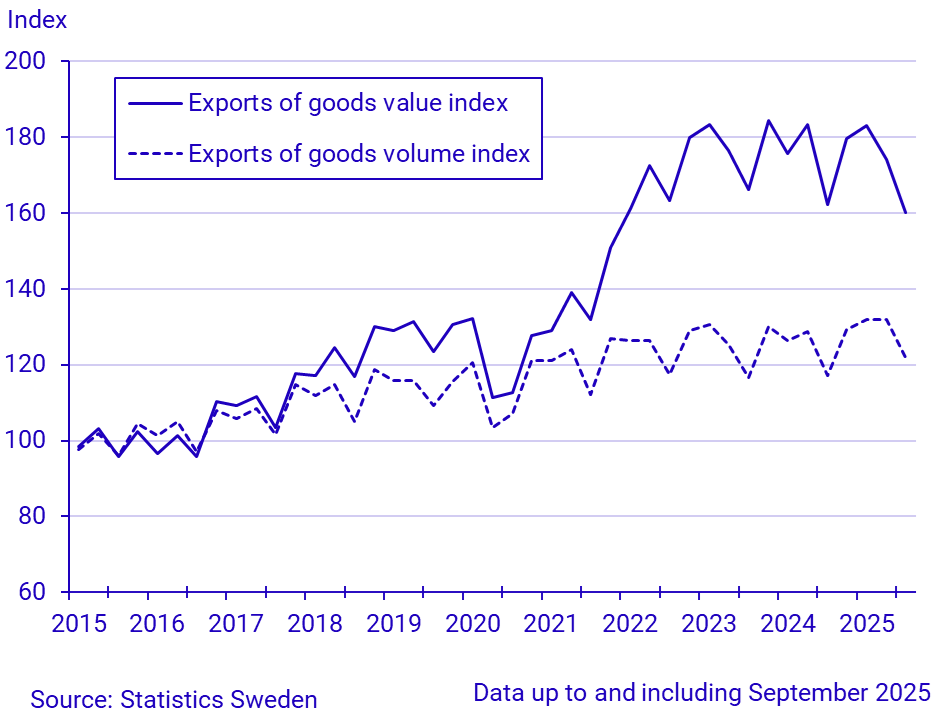
The value index and the volume index for exports of goods decreased in the third quarter compared with the second quarter. The value index is lower compared with the same period last year, while the volume index is higher.
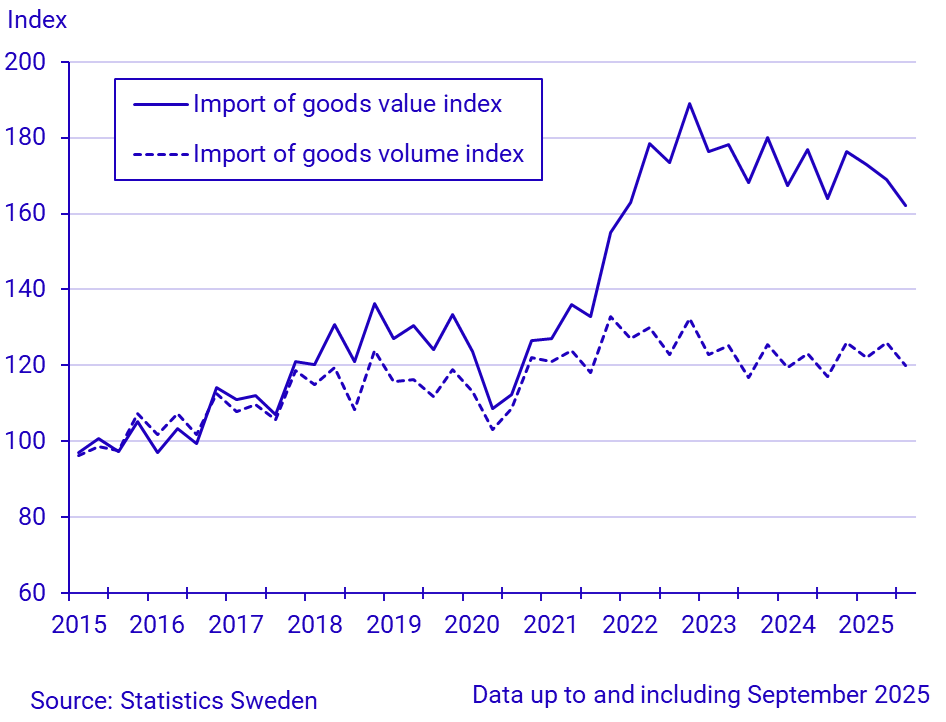
The value index and the volume index for imports of goods decreased in the third quarter compared with the second quarter. The value index is lower compared with the same period last year, while the volume index is higher.
Detailed information about January–September 2025 (in current prices and in constant prices)
Exports of iron ore and concentrates rose by 5 percent in value and by 22 percent in volume
Exports of machinery/transport equipment decreased by 3 percent in value in the period January-September 2025, while they increased by 2 percent in volume, compared with the same period a year ago. Within this product area, exports of passenger cars fell by 18 percent in value, and by 15 percent in volume. Exports of wood and paper products remained the same in value, while they fell by 3 percent in volume. Exports of minerals rose by 4 percent in value, and by 8 percent in volume. Within the product area, exports of iron ore and concentrates rose by 5 percent in value and by 22 percent in volume. Exports of chemicals/rubber products increased by 1 percent in value, and by 5 percent in volume. Exports of mineral fuels/electric current fell by 12 percent in value, while they rose by 4 percent in volume. The difference between value and volume development is due to lower prices for petroleum products. Within the other products area, exports of food/beverages/tobacco increased by 7 percent in value, and by 9 percent in volume.
Imports of food/beverages/tobacco rose by 6 percent in both value and volume
Imports of machinery/transport equipment increased by 1 percent in value, and by 3 percent in volume in the period January-September 2025, compared with the same period a year ago. Imports of wood and paper products fell by 1 percent in both value and volume. Imports of minerals decreased by 2 percent in value, while they increased by 2 percent in volume. Imports of chemicals/rubber products fell by 2 percent in value, while they remained the same in volume. Imports of mineral fuels/electric current fell by 19 percent in value, and by 1 percent in volume. The difference between value and volume development is due to lower prices for petroleum products. Within the other products area, imports of food/beverages/tobacco rose by 6 percent in both value and volume.
Detailed information about January–September 2025 (current prices)
Imports of goods from Norway fell by 10 percent
Sweden’s exports of goods to EU27 decreased by 1 percent, while imports from there remained the same compared with the same period a year ago. Exports to euro countries fell by 3 percent, and imports from there by 1 percent. Among the EU countries, exports to both Germany and Finland fell by 3 percent, while exports to Denmark rose by 4 percent. Imports from Germany decreased by 1 percent, while imports from Finland increased by 4 percent, and from Denmark by 2 percent.
Exports to other European countries increased by 4 percent, while imports from there decreased by 8 percent. Exports to the United Kingdom rose by 2 percent, while imports from there fell by 13 percent. Exports to Norway remained the same, while imports from there decreased by 10 percent. Exports to Russia rose by 41 percent, while imports from there fell by 95 percent. In the period, exports of chemicals/rubber products accounted for the increase to Russia.
Exports to Asia fell by 3 percent, while imports from there rose by 2 percent. Exports to China decreased by 14 percent, while imports from there increased by 7 percent.
Exports to the United States fell by 10 percent, while imports from there rose by 23 percent. In the period, imports of other transport equipment accounted for the increase from the United States.
| Exports | Imports | ||||||||
|---|---|---|---|---|---|---|---|---|---|
| Value (current prices, SEK million) | Value (current prices, SEK million) | ||||||||
| Region | January-September | Share in % | Change in % | January-September | Share in % | Change in % | |||
| 2025 | 2024 | 2025 | 2025/2024 | 2025 | 2024 | 2024 | 2025/2024 | ||
| Total | 1 525 743 | 1 538 102 | 100.0 | ‑1 | 1 470 000 | 1 482 624 | 100.0 | ‑1 | |
| Europe | 1 115 747 | 1 113 604 | 73.1 | 0 | 1 198 973 | 1 223 132 | 81.6 | ‑2 | |
| EU27_2020 | 822 453 | 830 247 | 53.9 | ‑1 | 979 885 | 983 992 | 66.7 | 0 | |
| EMU-20 | 618 648 | 634 703 | 40.5 | ‑3 | 759 233 | 768 888 | 51.6 | ‑1 | |
| Other European countries | 293 294 | 283 357 | 19.2 | 4 | 219 088 | 239 140 | 14.9 | ‑8 | |
| Africa | 30 497 | 29 906 | 2.0 | 2 | 11 184 | 19 582 | 0.8 | ‑43 | |
| North Africa | 16 365 | 15 437 | 1.1 | 6 | 4 619 | 7 616 | 0.3 | ‑39 | |
| West Africa | 4 067 | 2 271 | 0.3 | 79 | 3 582 | 10 011 | 0.2 | ‑64 | |
| Central, East and Southern Africa | 10 065 | 12 199 | 0.7 | ‑17 | 2 984 | 1 955 | 0.2 | 53 | |
| America | 186 964 | 194 512 | 12.3 | ‑4 | 96 279 | 77 866 | 6.5 | 24 | |
| North America | 153 622 | 161 862 | 10.1 | ‑5 | 69 642 | 58 047 | 4.7 | 20 | |
| Central and South America | 33 343 | 32 650 | 2.2 | 2 | 26 637 | 19 819 | 1.8 | 34 | |
| Asia | 172 300 | 177 646 | 11.3 | ‑3 | 160 744 | 157 627 | 10.9 | 2 | |
| Middle- and Near East | 34 883 | 34 543 | 2.3 | 1 | 5 018 | 11 222 | 0.3 | ‑55 | |
| Other countries in Asia | 137 417 | 143 103 | 9.0 | ‑4 | 155 726 | 146 404 | 10.6 | 6 | |
| Oceania and Antarctica | 14 842 | 16 910 | 1.0 | ‑12 | 2 818 | 4 417 | 0.2 | ‑36 | |
Definitions and explanations
The value index and the volume index describe nominal and real value trends over time. The real value trends describe trends in which price changes have been removed. The indices refer to chain indices with base year 2015=100.
Next publishing will be
The next item of statistical news in this series will be published on 2026-02-27.
Statistical Database
More information is available in the Statistical Database
Feel free to use the facts from this statistical news but remember to state Source: Statistics Sweden.