Exports and imports of goods, January-March 2022/quarter 1 2022, in current prices and in constant prices
Higher prices increase the value of trade in goods
Statistical news from Statistics Sweden 2022-05-30 8.00
In the first quarter 2022, exports of goods increased by 25 percent in value and by 5 percent in volume compared with the same period a year ago. At the same time, imports of goods rose by 28 percent in value and by 4 percent in volume.
Summary
- In the period January–March 2022, the value (in current prices) of Swedish exports of goods amounted to SEK 476 billion, an increase of 25 percent compared with the same period a year ago. At the same time, the value of imports of goods increased by 28 percent and amounted to SEK 471 billion.
- In the period January–March 2022, exports of goods increased by 5 percent in volume (in constant prices), and imports of goods increased by 4 percent.
- Net trade shows a surplus of SEK 5 billion in the period January–March 2022. In the same period in 2021, there was a net trade surplus of SEK 13 billion.
- Compared with the previous quarter, Swedish exports of goods increased by 6 percent in value while they remained the same in volume. Imports of goods increased by 4 percent in value while they decreased by 5 percent in volume.
Detailed information about January–March 2022 (current prices)
Imports of goods from United States increased by 40 percent
Sweden’s exports of goods to EU27 increased by 25 percent, and imports from there increased by 20 percent compared with the same period a year ago. Exports to the euro countries rose by 24 percent, and imports from there increased by 20 percent. Among the EU countries, exports to Germany increased by 27 percent and to both Denmark and Finland exports rose by 24 percent. Imports from Germany increased by 12 percent, from Denmark by 21 percent and from Finland by 42 percent. Machinery/transport equipment and minerals accounted for the largest import increase from Finland.
Exports to other European countries increased by 24 percent, and imports from there increased by 49 percent. Exports to the United Kingdom rose by 33 percent, and imports from there by 71 percent. During the period, exports of petroleum products and machinery/transport equipment accounted for the largest increase to the United Kingdom. Imports of crude petroleum oils accounted for the largest increase from the United Kingdom. Exports to Norway increased by 26 percent, and imports from there increased by 45 percent. In the period, exports of mineral fuels and machinery/transport equipment accounted for the largest increase to Norway. At the same time, imports of crude petroleum oils and minerals accounted for the largest increase from Norway. Exports to Russia fell by 17 percent, while imports from there rose by 83 percent. In the period, exports of machinery and transport equipment accounted for the largest decrease to Russia. At the same time, imports of crude petroleum oils accounted for the largest increase from Russia.
Exports to Asia rose by 11 percent, and imports from there by 41 percent. Exports to China decreased by 3 percent, while imports from there increased by 59 percent. In the period, imports of machinery and transport equipment accounted for the largest increase from China.
Both exports to and imports from the United States increased by 40 percent. In the period, exports of chemicals/rubber products and machinery/transport equipment accounted for the largest increase to Norway. At the same time, imports of machinery/transport equipment and mineral fuels/electric current accounted for the largest increase from the United States.
Detailed information about the first quarter 2022 (in current prices and in constant prices)
Exports of mineral fuels and electric current increased by 112 percent in value and by 7 percent in volume
In the first quarter of 2022, Sweden’s exports of goods increased by 25 percent in value and by 5 percent in volume, compared with the corresponding period a year ago.
Exports of machinery and transport equipment increased by 12 percent in value and by 2 percent in volume. Exports of mineral fuels and electric current rose by 82 percent in value while they remained the same in volume. The large difference between value and volume development is due to higher prices for oil products. Minerals increased by 32 percent in value and by 1 percent in volume. Chemical and rubber products rose by 37 percent in value and by 21 percent in volume. Exports of wood and paper products rose by 26 percent in value, while they remained the same in volume. Within the other products area, exports of food/beverages/tobacco increased by 22 percent in value and by 8 percent in volume.
Imports of food/beverages/tobacco increased by 26 percent in value and by 3 percent in volume
In the first quarter of 2022, Sweden’s imports of goods increased by 28 percent in value and by 4 percent in volume compared with the corresponding period a year ago.
Imports of machinery and transport equipment increased by 14 percent in value and by 5 percent in volume. Imports of mineral fuels and electric current rose by 87 percent in value while they remained the same in volume. Within this product area, imports of crude petroleum oils increased by 107 percent in value and by 13 percent in volume. The large difference between the value and volume development is due to higher crude oil prices. Imports of chemicals and rubber products rose by 34 percent in value and by 5 percent in volume. Imports of wood and paper products increased by 37 percent in value and by 9 percent in volume. Minerals rose by 46 percent in value and by 4 percent in volume. Within the other products area, imports of food/beverages/tobacco increased by 26 percent in value and by 3 percent in volume.
Value and volume trends
The value index and the volume index describe nominal and real value trends over time. The real value trends describe trends in which price changes have been removed. The indices are chain indices with base year 2015=100.
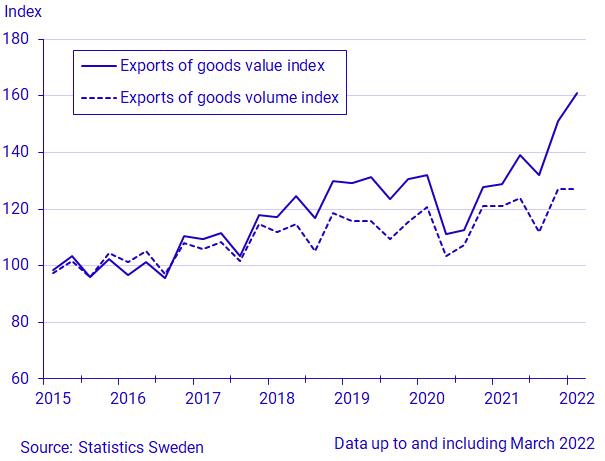
The value index for exports of goods in the first quarter 2022 has increased compared to the previous quarter, and is higher in the first quarter of 2022 than in any previous period. Export prices have increased since the previous quarter. The volume index has remained the same compared with the previous quarter, but is at a higher level than the volume index of the same quarter in 2021.
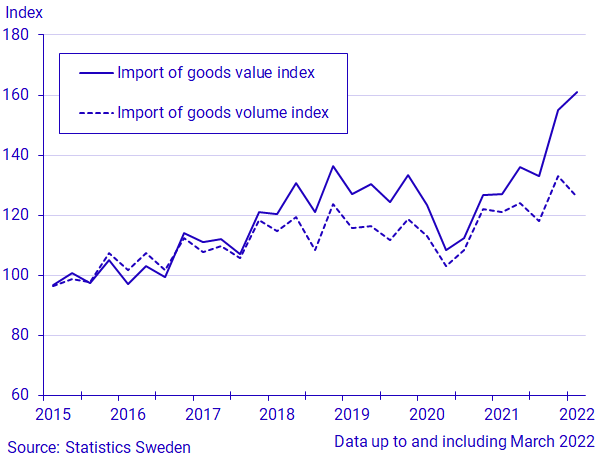
The value index for imports of goods increased in the first quarter 2022 compared to the previous quarter, and is higher than any previous period. Import prices are higher than in the previous quarter. The volume index has decreased compared with the previous quarter, but is at a higher level than the volume index of the same quarter in 2021.
| Exports | Imports | ||||||||
|---|---|---|---|---|---|---|---|---|---|
| Value (current prices) | Value (current prices) | ||||||||
| Region | January-March | Share in % | Change in % | January-March | Share in % | Change in % | |||
| 2022 | 2021 | 2022 | 2022/2021 | 2022 | 2021 | 2022 | 2022/2021 | ||
| Total | 475 791 | 381 888 | 100.0 | 25 | 470 986 | 369 248 | 100.0 | 28 | |
| Europe | 351 732 | 282 126 | 73.9 | 25 | 395 032 | 314 776 | 83.9 | 25 | |
| EU27_2020 | 259 075 | 207 139 | 54.5 | 25 | 302 139 | 252 536 | 64.2 | 20 | |
| EMU-19 | 192 979 | 155 732 | 40.6 | 24 | 236 175 | 196 022 | 50.1 | 20 | |
| Other European countries | 92 656 | 74 988 | 19.5 | 24 | 92 893 | 62 239 | 19.7 | 49 | |
| Africa | 8 126 | 5 957 | 1.7 | 36 | 2 909 | 999 | 0.6 | 191 | |
| North Africa | 4 330 | 3 057 | 0.9 | 42 | 1 152 | 500 | 0.2 | 130 | |
| West Africa | 953 | 684 | 0.2 | 39 | 988 | 7 | 0.2 | 14 014 | |
| Central, East and Southern Africa | 2 844 | 2 216 | 0.6 | 28 | 768 | 492 | 0.2 | 56 | |
| America | 59 270 | 42 200 | 12.5 | 40 | 17 868 | 13 825 | 3.8 | 29 | |
| North America | 49 047 | 35 350 | 10.3 | 39 | 14 313 | 10 960 | 3.0 | 31 | |
| Central and South America | 10 223 | 6 851 | 2.1 | 49 | 3 554 | 2 865 | 0.8 | 24 | |
| Asia | 51 194 | 46 316 | 10.8 | 11 | 54 553 | 38 811 | 11.6 | 41 | |
| Middle- and Near East | 7 634 | 7 202 | 1.6 | 6 | 849 | 878 | 0.2 | ‑3 | |
| Other countries in Asia | 43 561 | 39 114 | 9.2 | 11 | 53 705 | 37 933 | 11.4 | 42 | |
| Oceania and Antarctica | 4 096 | 3 912 | 0.9 | 5 | 617 | 569 | 0.1 | 8 | |
| Exports | ||||||
|---|---|---|---|---|---|---|
| Value (current prices) | Value (current prices) | Volume (value in constant prices) | ||||
| Share in % | Change in % | Change in % | ||||
| Commodity group according to SITC | January-March 2022 | January-March 2021 | January-March 2022 | Q1 2022/Q1 2021 | Q1 2022/Q1 2021 | |
| Total | 475 791 | 381 888 | 100.0 | 25 | 5 | |
| Wood and paper products | 48 572 | 38 485 | 10.2 | 26 | 0 | |
| Wood | 14 398 | 9 668 | 3.0 | 49 | 14 | |
| Pulp and waste paper | 7 781 | 6 598 | 1.6 | 18 | ‑10 | |
| Paper, paperproducts | 24 129 | 20 360 | 5.1 | 19 | ‑5 | |
| Minerals | 55 491 | 42 168 | 11.7 | 32 | 1 | |
| Iron ore and concentrates | 8 145 | 8 640 | 1.7 | ‑6 | ‑1 | |
| Iron and steel | 23 511 | 16 604 | 4.9 | 42 | ‑6 | |
| Non-ferrous metals | 13 078 | 8 662 | 2.7 | 51 | 16 | |
| Chemicals, rubber products | 73 393 | 53 464 | 15.4 | 37 | 21 | |
| Organic/inorganic chemicals | 7 529 | 5 292 | 1.6 | 42 | 2 | |
| Pharmaceuticals products | 34 101 | 23 148 | 7.2 | 47 | 40 | |
| Plastics | 13 149 | 9 587 | 2.8 | 37 | 8 | |
| Mineral fuels, electric current | 45 097 | 24 744 | 9.5 | 82 | 0 | |
| Petroleum products | 35 287 | 18 238 | 7.4 | 93 | 9 | |
| Machinery, transport equipment | 191 541 | 170 635 | 40.3 | 12 | 2 | |
| Manufactures of metals | 12 335 | 10 517 | 2.6 | 17 | 0 | |
| Industrial machinery | 61 031 | 55 961 | 12.8 | 9 | 1 | |
| Electronics, telecommunication | 44 159 | 38 379 | 9.3 | 15 | 4 | |
| Road vehicles | 60 350 | 54 695 | 12.7 | 10 | ‑2 | |
| Passenger cars | 31 850 | 28 927 | 6.7 | 10 | ‑5 | |
| Lorries, trucks[1] | 9 136 | 7 437 | 1.9 | 23 | 10 | |
| Parts, accessories | 14 713 | 14 605 | 3.1 | 1 | ‑7 | |
| Other transport equipment | 3 618 | 2 269 | 0.8 | 59 | 47 | |
| Instruments, photo/optical products | 10 048 | 8 814 | 2.1 | 14 | 5 | |
| Other products | 61 696 | 52 392 | 13.0 | 18 | 6 | |
| Food, beverages, tobacco | 29 120 | 23 931 | 6.1 | 22 | 8 | |
| Textiles, clothing, footwear | 12 867 | 11 193 | 2.7 | 15 | 8 | |
| Furniture | 5 880 | 4 943 | 1.2 | 19 | 6 | |
| Imports | ||||||
|---|---|---|---|---|---|---|
| Value (current prices) | Value (current prices) | Volume (value in constant prices) | ||||
| Share in % | Change in % | Change in % | ||||
| Commodity group according to SITC | January-March 2022 | January-March 2021 | January-March 2022 | Q1 2022/Q1 2021 | Q1 2022/Q1 2021 | |
| Total | 470 986 | 369 248 | 100.0 | 28 | 4 | |
| Wood and paper products | 13 158 | 9 632 | 2.8 | 37 | 9 | |
| Minerals | 42 969 | 29 373 | 9.1 | 46 | 4 | |
| Iron and steel | 19 636 | 11 506 | 4.2 | 71 | 12 | |
| Non-ferrous metals | 9 920 | 6 334 | 2.1 | 57 | 5 | |
| Metalliferrous ores, metal scrap | 5 689 | 5 320 | 1.2 | 7 | ‑20 | |
| Chemicals, rubber products | 62 081 | 46 432 | 13.2 | 34 | 5 | |
| Organic/inorganic chemicals | 13 127 | 8 298 | 2.8 | 58 | 0 | |
| Pharmaceuticals products | 15 683 | 12 777 | 3.3 | 23 | 10 | |
| Plastics | 12 649 | 8 808 | 2.7 | 44 | 8 | |
| Crude rubber, rubber products | 5 120 | 4 417 | 1.1 | 16 | 4 | |
| Mineral fuels, electric current | 57 255 | 30 574 | 12.2 | 87 | 0 | |
| Crude petroleum oils | 33 004 | 15 941 | 7.0 | 107 | 13 | |
| Petroleum products | 17 726 | 10 736 | 3.8 | 65 | ‑8 | |
| Machinery, transport equipment | 194 314 | 170 699 | 41.3 | 14 | 5 | |
| Manufactures of metals | 16 401 | 12 204 | 3.5 | 34 | 13 | |
| Industrial machinery | 44 995 | 39 641 | 9.6 | 14 | 5 | |
| Electronics, telecommunication | 73 155 | 61 124 | 15.5 | 20 | 11 | |
| Road vehicles | 45 656 | 45 925 | 9.7 | ‑1 | ‑6 | |
| Passenger cars | 21 677 | 24 293 | 4.6 | ‑11 | ‑13 | |
| Parts and accessories | 14 959 | 14 240 | 3.2 | 5 | ‑4 | |
| Other transport equipment | 3 199 | 2 074 | 0.7 | 54 | 38 | |
| Instruments, photo/optical equip | 10 908 | 9 731 | 2.3 | 12 | 6 | |
| Other products | 101 208 | 82 538 | 21.5 | 23 | 5 | |
| Food, beverages, tobacco | 47 022 | 37 407 | 10.0 | 26 | 3 | |
| Textiles, clothing, footwear | 23 653 | 21 203 | 5.0 | 12 | ‑1 | |
| Furniture | 8 562 | 6 740 | 1.8 | 27 | 12 | |
Definitions and explanations
The United Kingdom’s withdrawal from the European Union has led to the replacement of the former EU28 group in the country tables for foreign trade in goods with the EU27_2020 group. This change applies to country tables with data reported as from January 2020. The cutoff point is January 2020, rather than the actual withdrawal month February 2020, since the values in the tables are based on accumulated periods starting from January.
Next publishing will be
2022-08-27 at 08:00.
Statistical Database
More information is available in the Statistical Database
Feel free to use the facts from this statistical news but remember to state Source: Statistics Sweden.