Exports and imports of goods, quarter 1 2023, in current prices and in constant prices
Weaker imports of goods in the first quarter compared with the previous quarter
Statistical news from Statistics Sweden 2023-05-30 8.00
In the first quarter of 2023, exports of goods increased by 13 percent in value and by 3 percent in volume compared with the same period a year ago. At the same time, imports of goods rose by 9 percent in value while they decreased by 2 percent in volume.
- Imports of food/beverages/tobacco continue to show a strong increase in value in the first quarter, says Maria Adolfsson, statistician at Statistics Sweden.
Summary
- In the first quarter of 2023, the value (in current prices) of Swedish exports of goods amounted to SEK 538 billion, an increase of 13 percent compared with the quarter a year ago. At the same time, the value of imports of goods increased by 9 percent and amounted to SEK 516 billion.
- In the first quarter of 2023, exports of goods increased by 3 percent in volume (in constant prices), while imports of goods decreased by 2 percent.
- Net trade shows a surplus of SEK 22 billion in the first quarter of 2023. In the same quarter in 2022, there was a net trade surplus of SEK 4 billion.
- Compared with the previous quarter, Swedish exports of goods increased by 1 percent in both value and volume. Imports of goods decreased by 6 percent in value and by 7 percent in volume.
Detailed information about countries in the first quarter of 2023 (in current prices)
Imports from the United States increased by 51 percent
Sweden’s exports of goods to EU27 increased by 16 percent, and imports from there increased by 14 percent compared with the same quarter a year ago. Exports to the euro countries rose by 18 percent, and imports from there increased by 15 percent. Among the EU countries, exports to Germany increased by 15 percent, to Denmark by 10 percent and to Finland by 13 percent. Imports from Germany increased by 16 percent, from Denmark by 11 percent and from Finland by 2 percent.
Exports to other European countries increased by 6 percent, while imports from there decreased by 7 percent. Exports to the United Kingdom rose by 10 percent, while imports from there fell by 20 percent. Exports to Norway increased by 2 percent, and imports from there increased by 3 percent. Exports to Russia fell by 34 percent, and imports from there fell by 98 percent.
Exports to Asia rose by 12 percent, while imports from there fell by 6 percent. Exports to China increased by 15 percent, while imports from there decreased by 18 percent.
Exports to the United States increased by 10 percent, and imports from there increased by 51 percent. In the first quarter, imports of chemicals/rubber products and mineral fuels/electric current accounted for the largest increase from the United States.
Detailed information about product areas in the first quarter of 2023 (in current and constant prices)
Exports of passenger cars increased by 31 percent in value and by 20 percent in volume
In the first quarter of 2023, Sweden’s exports of goods increased by 13 percent in value and by 3 percent in volume, compared with the corresponding quarter a year ago.
Exports of machinery and transport equipment increased by 21 percent in value and by 6 percent in volume. Within the product area, exports of passenger cars increased by 31 percent in value and by 20 percent in volume. Exports of mineral fuels and electric current rose by 1 percent in value while they remained the same in volume. Minerals increased by 6 percent in value and by 1 percent in volume. Chemical and rubber products rose by 12 percent in value and by 3 percent in volume. Exports of wood and paper products rose by 4 percent in value, while they fell by 1 percent in volume. Within the other products area, exports of food/beverages/tobacco increased by 17 percent in value and by 2 percent in volume.
Imports of food/beverages/tobacco increased by 19 percent in value while they decreased by 1 percent in volume
In the first quarter of 2023, Sweden’s imports of goods increased by 9 percent in value while they decreased by 2 percent in volume compared with the corresponding quarter a year ago.
Imports of machinery and transport equipment increased by 15 percent in value and by 1 percent in volume. Within the product area, imports of passenger cars increased by 32 percent in value and by 21 percent in volume. Imports of mineral fuels and electric current fell by 2 percent in both value and in volume. Imports of chemicals and rubber products rose by 15 percent in value and by 3 percent in volume. Imports of wood and paper products increased by 11 percent in value while they fell by 13 percent in volume. Minerals fell by 2 percent in value and by 6 percent in volume. Within the other products area, imports of food/beverages/tobacco increased by 19 percent in value while they decreased by 1 percent in volume.
Value and volume trends
The value index and the volume index describe nominal and real value trends over time. The real value trends describe trends in which price changes have been removed. The indices are chain indices with base year 2015=100.
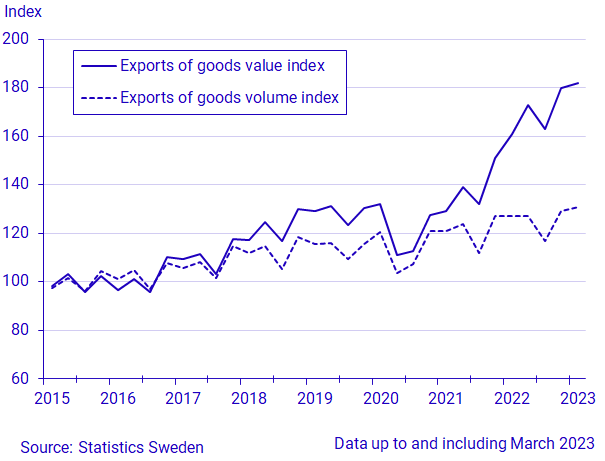
The value index for exports of goods has increased compared to the previous quarter, and is higher in the first quarter of 2023 than in any previous period. Export prices have increased since the previous quarter. The volume index is higher the first quarter 2023 compared to any previous period. The difference between value- and volume index for exports of goods is the same as for the fourth quarter 2022.
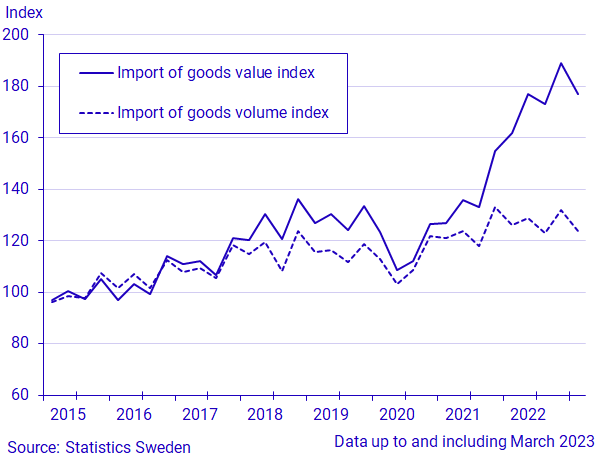
The value index for imports of goods first quarter 2023 has decreased compared to the previous quarter, which indicate that import prices have decreased since the fourth quarter 2022. The volume index has decreased both compared with the previous quarter and with the same period last year.
| Exports | Imports | ||||||||
|---|---|---|---|---|---|---|---|---|---|
| Value (current prices) | Value (current prices) | ||||||||
| Region | January-March | Share in % | Change in % | January-March | Share in % | Change in % | |||
| 2023 | 2022 | 2023 | 2023/2022 | 2023 | 2022 | 2023 | 2023/2022 | ||
| Total | 538 429 | 476 252 | 100.0 | 13 | 516 329 | 472 203 | 100.0 | 9 | |
| Europe | 398 730 | 352 214 | 74.1 | 13 | 431 915 | 395 215 | 83.7 | 9 | |
| EU27_2020 | 300 319 | 259 580 | 55.8 | 16 | 344 352 | 301 539 | 66.7 | 14 | |
| EMU-20 | 228 778 | 194 097 | 42.5 | 18 | 270 494 | 235 916 | 52.4 | 15 | |
| Other European countries | 98 411 | 92 634 | 18.3 | 6 | 87 563 | 93 676 | 17.0 | ‑7 | |
| Africa | 9 704 | 8 202 | 1.8 | 18 | 4 320 | 3 282 | 0.8 | 32 | |
| North Africa | 4 614 | 4 336 | 0.9 | 6 | 1 622 | 1 153 | 0.3 | 41 | |
| West Africa | 1 354 | 949 | 0.3 | 43 | 1 859 | 1 269 | 0.4 | 46 | |
| Central, East and Southern Africa | 3 735 | 2 917 | 0.7 | 28 | 838 | 860 | 0.2 | ‑3 | |
| America | 65 297 | 59 229 | 12.1 | 10 | 26 267 | 18 323 | 5.1 | 43 | |
| North America | 54 763 | 49 023 | 10.2 | 12 | 22 664 | 14 753 | 4.4 | 54 | |
| Central and South America | 10 534 | 10 205 | 2.0 | 3 | 3 603 | 3 570 | 0.7 | 1 | |
| Asia | 57 361 | 51 182 | 10.7 | 12 | 51 661 | 54 755 | 10.0 | ‑6 | |
| Middle- and Near East | 9 537 | 7 634 | 1.8 | 25 | 3 518 | 843 | 0.7 | 317 | |
| Other countries in Asia | 47 824 | 43 548 | 8.9 | 10 | 48 143 | 53 911 | 9.3 | ‑11 | |
| Oceania and Antarctica | 5 385 | 4 093 | 1.0 | 32 | 2 142 | 621 | 0.4 | 245 | |
| Exports | ||||||
|---|---|---|---|---|---|---|
| Value (current prices) | Value (current prices) | Volume (value in constant prices) | ||||
| Share in % | Change in % | Change in % | ||||
| Commodity group according to SITC | January-March 2023 | January-March 2022 | January-March 2023 | Q1 2023/Q1 2022 | Q1 2023/Q1 2022 | |
| Total | 538 429 | 476 252 | 100.0 | 13 | 3 | |
| Wood and paper products | 50 339 | 48 623 | 9.3 | 4 | ‑1 | |
| Wood | 11 764 | 14 392 | 2.2 | ‑18 | 20 | |
| Pulp and waste paper | 9 073 | 7 778 | 1.7 | 17 | ‑9 | |
| Paper, paper products | 27 391 | 24 174 | 5.1 | 13 | ‑9 | |
| Minerals | 58 554 | 55 431 | 10.9 | 6 | 1 | |
| Iron ore and concentrates | 9 229 | 8 143 | 1.7 | 13 | 0 | |
| Iron and steel | 25 397 | 23 423 | 4.7 | 8 | 3 | |
| Non-ferrous metals | 12 549 | 13 069 | 2.3 | ‑4 | ‑6 | |
| Chemicals, rubber products | 82 233 | 73 495 | 15.3 | 12 | 3 | |
| Organic/inorganic chemicals | 9 630 | 7 543 | 1.8 | 28 | 13 | |
| Pharmaceutical products | 39 476 | 34 162 | 7.3 | 16 | 8 | |
| Plastics | 12 322 | 13 155 | 2.3 | ‑6 | ‑8 | |
| Mineral fuels, electric current | 45 654 | 45 033 | 8.5 | 1 | 0 | |
| Petroleum products | 35 803 | 35 332 | 6.6 | 1 | ‑1 | |
| Machinery, transport equipment | 231 500 | 192 071 | 43.0 | 21 | 6 | |
| Manufactures of metals | 13 159 | 12 358 | 2.4 | 6 | ‑5 | |
| Industrial machinery | 76 304 | 61 109 | 14.2 | 25 | 10 | |
| Electronics, telecommunication | 49 532 | 44 140 | 9.2 | 12 | ‑6 | |
| Road vehicles | 79 086 | 60 442 | 14.7 | 31 | 17 | |
| Passenger cars | 41 717 | 31 839 | 7.7 | 31 | 20 | |
| Lorries, trucks[1] | 12 932 | 9 126 | 2.4 | 42 | 17 | |
| Parts, accessories | 18 931 | 14 849 | 3.5 | 27 | 14 | |
| Other transport equipment | 2 102 | 4 025 | 0.4 | ‑48 | ‑52 | |
| Instruments, photo/optical products | 11 316 | 9 996 | 2.1 | 13 | 2 | |
| Other products | 70 150 | 61 600 | 13.0 | 14 | 1 | |
| Food, beverages, tobacco | 34 096 | 29 216 | 6.3 | 17 | 2 | |
| Textiles, clothing, footwear | 14 382 | 12 678 | 2.7 | 13 | 4 | |
| Furniture | 6 255 | 5 890 | 1.2 | 6 | ‑12 | |
| Imports | ||||||
|---|---|---|---|---|---|---|
| Value (current prices) | Value (current prices) | Volume (value in constant prices) | ||||
| Share in % | Change in % | Change in % | ||||
| Commodity group according to SITC | January-March 2023 | January-March 2022 | January-March 2023 | Q1 2023/Q1 2022 | Q1 2023/Q1 2022 | |
| Total | 516 329 | 472 203 | 100.0 | 9 | ‑2 | |
| Wood and paper products | 14 638 | 13 176 | 2.8 | 11 | ‑13 | |
| Minerals | 42 060 | 42 936 | 8.1 | ‑2 | ‑6 | |
| Iron and steel | 17 862 | 19 625 | 3.5 | ‑9 | ‑8 | |
| Non-ferrous metals | 9 042 | 9 939 | 1.8 | ‑9 | ‑9 | |
| Metalliferrous ores, metal scrap | 7 405 | 5 681 | 1.4 | 30 | 31 | |
| Chemicals, rubber products | 71 510 | 62 344 | 13.8 | 15 | 3 | |
| Organic/inorganic chemicals | 18 676 | 13 282 | 3.6 | 41 | 16 | |
| Pharmaceutical products | 18 127 | 15 784 | 3.5 | 15 | 6 | |
| Plastics | 11 931 | 12 548 | 2.3 | ‑5 | ‑6 | |
| Crude rubber, rubber products | 5 835 | 5 142 | 1.1 | 13 | ‑4 | |
| Mineral fuels, electric current | 56 916 | 58 360 | 11.0 | ‑2 | ‑2 | |
| Crude petroleum oils | 29 919 | 33 704 | 5.8 | ‑11 | ‑5 | |
| Petroleum products | 20 535 | 18 518 | 4.0 | 11 | ‑3 | |
| Machinery, transport equipment | 222 324 | 193 767 | 43.1 | 15 | 1 | |
| Manufactures of metals | 16 942 | 16 409 | 3.3 | 3 | ‑10 | |
| Industrial machinery | 53 353 | 45 302 | 10.3 | 18 | 3 | |
| Electronics, telecommunication | 77 038 | 71 927 | 14.9 | 7 | ‑6 | |
| Road vehicles | 59 182 | 45 976 | 11.5 | 29 | 14 | |
| Passenger cars | 28 996 | 21 891 | 5.6 | 32 | 21 | |
| Parts and accessories | 19 058 | 14 929 | 3.7 | 28 | 5 | |
| Other transport equipment | 3 215 | 3 247 | 0.6 | ‑1 | ‑9 | |
| Instruments, photo/optical equip | 12 593 | 10 907 | 2.4 | 15 | 4 | |
| Other products | 108 882 | 101 619 | 21.1 | 7 | ‑8 | |
| Food, beverages, tobacco | 55 992 | 47 191 | 10.8 | 19 | ‑1 | |
| Textiles, clothing, footwear | 24 272 | 23 902 | 4.7 | 2 | ‑10 | |
| Furniture | 7 096 | 8 530 | 1.4 | ‑17 | ‑29 | |
Definitions and explanations
The United Kingdom’s withdrawal from the European Union has led to the replacement of the former EU28 group in the country tables for foreign trade in goods with the EU27_2020 group. This change applies to country tables with data reported as from January 2020. The cutoff point is January 2020, rather than the actual withdrawal month February 2020, since the values in the tables are based on accumulated periods starting from January.
Next publishing will be
2023-08-29 at 08:00.
Statistical Database
More information is available in the Statistical Database
Feel free to use the facts from this statistical news but remember to state Source: Statistics Sweden.