Industrial capacity utilisation, third quarter 2023
Decreased capacity utilisation in industry
Statistical news from Statistics Sweden 2023-11-21 8.00
Capacity utilisation in industry decreased by 0.5 percentage points in the third quarter of 2023 compared with the second quarter of 2023 in seasonally adjusted figures.
The decrease in capacity utilisation in industry in the third quarter led to a decrease in the level of utilisation, which amounted to 90.0 percent in seasonally adjusted figures.
On an annual basis, capacity utilisation decreased by 0.3 percentage points compared with the third quarter of 2022 and amounted to 89.8 percent in calendar adjusted figures.
The figures for the third quarter of 2023 are preliminary. Since the previous publication capacity utilisation in the second quarter of 2023 compared with the first quarter of 2023 has been revised downwards by 0.7 percentage points, to a utilisation rate of 90.5 percent in seasonally adjusted figures.
Capacity utilisation in the second quarter of 2023 compared with the corresponding quarter a year ago has been revised downwards by 0.6 percentage points to a utilisation rate of 91.0 percent in calendar adjusted figures.
1) Calendar and seasonally adjusted figures 2) Calendar adjusted figures
Statistics under development
When businesses have below 100% in capacity utilization, they can indicate the main reason for the lower capacity utilization. The proportion who responded to each reason is distributed as follows
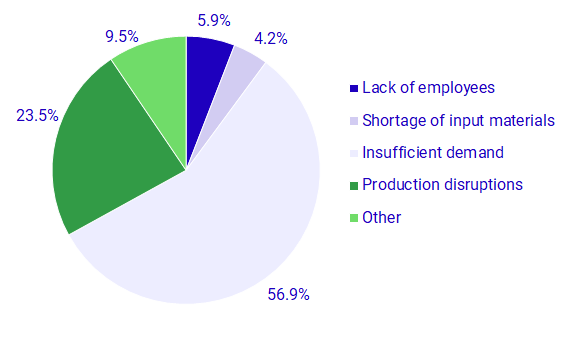
The main reason for the lower capacity utilization is insufficient demand (56.9%), followed by production disruptions (23.5%).
Please note that this part of the statistics is under development and may change.
Other information
Outdated tables
The table "Industrial capacity utilisation, actual utilisation by industrial classification SNI2007 (aggregates). Quarter 1990K1 - 2023K1" is no longer updated as of 2023-08-18. The reason for this is a reduced sample as a result of the increased use of VAT data for industry turnover. Consequently, since then, the industry's capacity utilization has only been presented for the total industrial sector (B+C).
Revisions
When capacity utilisation for a new quarter is published, the percentages for the previous quarter are also revised. Normally, the figures for the previous quarter are revised mainly due to new and revised information.
Next publishing will be
2024-02-20 at 08:00.
Statistical Database
More information is available in the Statistical Database
Feel free to use the facts from this statistical news but remember to state Source: Statistics Sweden.