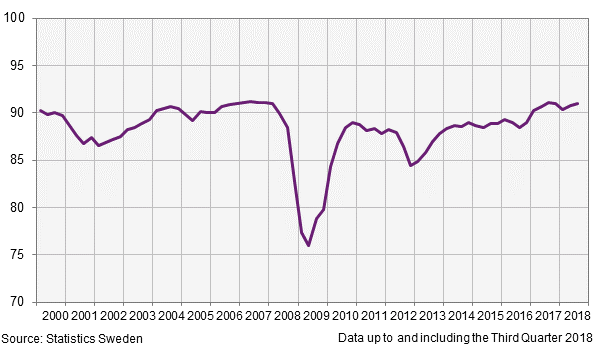
Industrial capacity utilisation, 3rd quarter 2018:
Capacity utilisation in industry increased
Statistical news from Statistics Sweden 2018-11-14 9.30
Capacity utilisation in industry increased by 0.2 percentage points in the third quarter of 2018 compared with the second quarter of 2018 in seasonally adjusted figures.
This increased capacity utilisation in industry meant that the level of utilisation increased to 91.0 percent in seasonally adjusted figures.
On an annual basis, capacity utilisation remains unchanged compared with the third quarter of 2017 and was 90.8 percent in calendar adjusted figures.
The figures for the third quarter of 2018 are preliminary. Since the previous publication, capacity utilisation in the second quarter of 2018 compared with the first quarter of 2018 has been revised downwards by 0.1 percentage point to 90.8 percent. Capacity utilisation in the second quarter of 2018 compared with the corresponding quarter of the previous year has been revised downwards by 0.1 percentage point, which means it remains unchanged from the corresponding quarter of the previous year.

| NACE 2007 | INDUSTRY TITLE | Seasonally adjusted figures | |||||||
|---|---|---|---|---|---|---|---|---|---|
| 2017 | 2018 | Q3 2018– Q2 2018 [1] | Q3 2018– Q3 2017[2] | ||||||
| Q3 | Q4 | Q1 | Q2 | Q3 | |||||
|
B+C
|
Mines and quarries and manufacturing industry
|
91.1 | 91.0 | 90.3 | 90.8 | 91.0 | 0.2 | 0.0 | |
|
-
|
Intermediate goods industry
|
93.0 | 92.0 | 90.8 | 90.3 | 90.1 | ‑0.2 | ‑2.9 | |
|
-
|
Capital goods industry
|
93.0 | 93.4 | 92.4 | 93.4 | 94.3 | 0.9 | 1.3 | |
|
-
|
Non-durable consumer goods industry
|
83.2 | 85.9 | 86.3 | 85.6 | 85.8 | 0.2 | 2.6 | |
|
-
|
Durable consumer goods industry
|
90.1 | 91.8 | 91.3 | 92.2 | 92.2 | 0.0 | 2.2 | |
|
B
|
Mines and quarries
|
94.3 | 95.7 | 95.2 | 90.2 | 93.6 | 3.4 | ‑0.7 | |
|
C
|
Manufacturing industry
|
91.0 | 90.8 | 90.2 | 90.8 | 91.0 | 0.2 | 0.1 | |
|
20-21
|
Industry for chemicals and pharmaceutical products
|
78.8 | 79.9 | 80.3 | 80.1 | 79.7 | ‑0.4 | 0.9 | |
|
24
|
Industry for basic metals
|
95.6 | 95.7 | 94.1 | 93.6 | 94.1 | 0.5 | ‑1.3 | |
|
26
|
Industry for manufacture of computer, electronic and optical products
|
83.4 | 83.2 | 78.8 | 85.5 | 84.9 | ‑0.6 | 1.6 | |
|
28
|
Industry for machinery and equipment n.e.c.
|
95.8 | 96.2 | 93.6 | 92.6 | 92.2 | ‑0.4 | ‑3.4 | |
|
29
|
Industry for motor vehicles
|
94.2 | 94.4 | 93.9 | 95.1 | 97.5 | 2.4 | 3.5 | |
Revisions
When capacity utilisation for a new quarter is published, the percentage figure for the previous quarter is also revised. The material for the previous quarter is normally revised. This is mainly due to receipt of new and revised information.
Next publishing will be
2019-02-20 at 09:30.
Statistical Database
More information is available in the Statistical Database
Feel free to use the facts from this statistical news but remember to state Source: Statistics Sweden.
