Party Preference Survey in May 2025 – Election today
Political Party Preference Survey, May 2025
Statistical news from Statistics Sweden 2025-06-05 8.00
The Political Party Preference Survey presents election results if a parliamentary election were held in May 2025, as well as changes since May 2024 and since the 2022 parliamentary election.
In an election in May 2025, the votes would be cast as follows (percentage and margin of uncertainty).
Social Democratic Party (S): 36.2 percent ± 1.2 percentage point
Moderate Party (M): 18.3 percent ± 0.9 percentage point
Sweden Democrats (SD): 18.0 percent ± 1.0 percentage point
Left Party (V): 7.1 percent ± 0.7 percentage point
Green Party (MP): 6.5 percent ± 0.7 percentage point
Centre Party (C): 5.5 percent ± 0.6 percentage point
Christian Democrats (KD): 3.4 percent ± 0.5 percentage point
Liberal Party (L): 2.8 percent ± 0.4 percentage point
Other parties: 2.3 percent ± 0.5 percentage point
The proportion of those in the electorate who were undecided was 22.2 percent (± 1.3 percentage points) in May 2025.
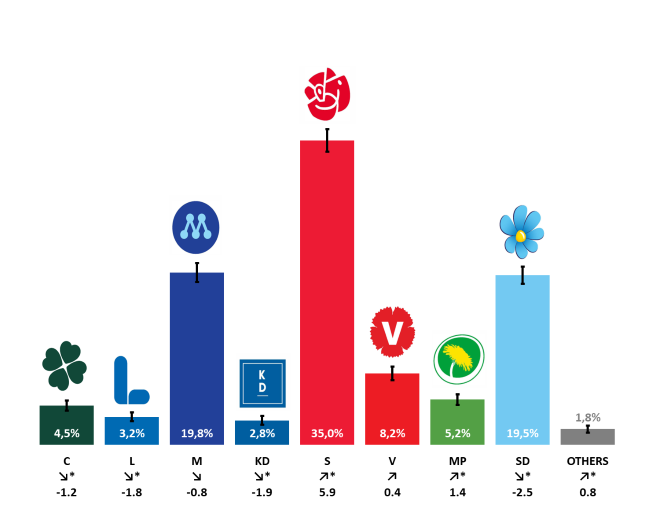
The change refers to a comparison with the 2022 parliamentary election in percentage points. Statistically significant changes are marked with an asterisk (*).
The table below presents estimates of the political parties in May 2025, in May 2024, and the latest election results. The table also shows changes from the May 2024 survey results and the 2022 parliamentary election. Statistically significant changes are marked with an asterisk (*).
| Estimate May 2025 | Estimate May 2024 | ||||||
|---|---|---|---|---|---|---|---|
| Party | Percent | Margin of error | Percent | Margin of error | Change since May 2024 | Election 2022 | Change since election 2022 |
| C | 5.5 | ±0.6 | 4.5 | ±0.6 | 1.0* | 6.7 | ‑1.2* |
| L | 2.8 | ±0.4 | 3.2 | ±0.5 | ‑0.4* | 4.6 | ‑1.8* |
| M | 18.3 | ±0.9 | 19.8 | ±1.1 | ‑1.5* | 19.1 | ‑0.8 |
| KD | 3.4 | ±0.5 | 2.8 | ±0.5 | 0.6* | 5.3 | ‑1.9* |
| S | 36.2 | ±1.2 | 35.0 | ±1.3 | 1.2 | 30.3 | 5.9* |
| V | 7.1 | ±0.7 | 8.2 | ±0.8 | ‑1.1* | 6.7 | 0.4 |
| MP | 6.5 | ±0.7 | 5.2 | ±0.6 | 1.3* | 5.1 | 1.4* |
| SD | 18 | ±1.0 | 19.5 | ±1.0 | ‑1.5* | 20.5 | ‑2.5* |
| other | 2.3 | ±0.5 | 1.8 | ±0.4 | 0.5* | 1.5 | 0.8* |
* The change is statistically significant.
The political parties in May 2025
Changes in all political parties compared with the May 2024 survey and the September 2022 parliamentary election are described below. The flow of voters between the political parties is also described below as a percentage of the electorate. Only statistically significant flows of voters are presented.
Centre Party
If an election were held in May 2025, the Centre Party would receive 5.5 ± 0.6 percent of the votes. This is a statistically significant increase compared with May 2024, while it is a statistically significant decrease in relation to the 2022 parliamentary election.
Compared with May 2024, the Centre Party has a statistically significant net gain of about 0.3 percent from the Liberal Party.
In relation to the 2022 parliamentary election, the Centre Party has a statistically significant net loss of about 0.9 percent to the Social Democratic Party.
Liberal Party
The Liberal Party would receive 2.8 ± 0.4 percent of the votes in an election in May 2025. This is a statistically significant loss compared with compared with both May 2024 and the 2022 parliamentary election.
Compared with May 2024, the Liberal Party has a statistically significant net loss of about 0.3 percent to the Centre Party.
In relation to the 2022 parliamentary election, the Liberal Party has statistically significant net losses of about 0.6 percent to the Social democratic Party and about 0.4 percent to the Moderate Party.
Moderate Party
If an election were held in May 2025, the Moderate Party would receive 18.3 ± 0.9 percent of the votes. This is a statistically significant decrease compared with May 2024 while it is not a statistically significant change compared with the 2022 parliamentary election.
Compared with the 2022 parliamentary election, the Moderate Party has statistically significant net gains of about 0.8 percent from the Sweden Democrats, about 0.5 percent from the Christian Democrats and about 0.4 percent from the Liberal Party. At the same time the Moderate Party has a statistically significant net loss of about 1.2 percent to the Social Democratic Party.
Christian Democrats
The Christian Democrats would receive 3.4 ± 0.5 percent of the votes in an election in May 2025. This is a statistically significant increase compared with May 2024 while it is a statistically significant decrease compared wiht the 2022 parliamentary election.
In relation to the 2022 parliamentary election, the Christian Democrats noted statistically significant net losses of about 0.5 percent to the Moderate Party, about 0.4 percent to the Social Democratic Party and about 0.2 percent to the Left party.
Social Democratic Party
The Social Democratic Party would receive 36.2 ± 1.2 percent of the votes in an election in May 2025. This is not a statistically significant change compared with May 2024, while it is a statistically significant increase compared with the 2022 parliamentary election.
In relation to the 2022 parliamentary election, there are statistically significant net gains noted of about 1.2 percent each from the Moderate Party and the Sweden Democrats, about 0.9 from the Centre Party, about 0.6 percent from the Liberal Party and about 0.4 percent from the Christian Democrats.
Left Party
If an election were held in May 2025, the Left Party would receive 7.1 ± 0.7 percent of the votes. This is a statistically significant decrease compared with May 2024 while it is not a statistically significant change compared with the 2022 parliamentary election.
Compared with the 2022 parliamentary election, the Left Party noted a statistically significant net gain of about 0.2 from the Christian Democrats.
Green Party
If an election were held in May 2025, the Green Party would receive 6.5 ± 0.7 percent of the votes. This is a statistically significant increase compared with both May 2024 and the 2022 parliamentary election.
Compared with the 2022 parliamentary election, the Green Party noted a statistically significant net gain of about 0.2 from the Moderate Party.
Sweden Democrats
The Sweden Democrats would receive 18.0 ± 1.0 percent of the votes in an election in May 2025. This is a statistically significant decrease compared with both May 2024 and the 2022 parliamentary election.
The Sweden Democrats has compared with May 2024 a statistically significant net loss of about 0.4 percent to the “other parties” group.
Compared with the 2022 parliamentary election, the Sweden Democrats noted statistically significant net losses of about 1.2 percent to the Social Democratic Party, about 0.8 percent to the Moderate Party and 0.4 percent to the “other parties” group.
Other parties
The “other parties” group would receive 2.3 ± 0.5 percent of the votes in an election in May 2025. This is a statistically significant increase compared with both May 2024 and with the 2022 parliamentary election.
Compared with May 2024 the “other parties” group noted a statistically significant net gain of about 0.4 percent from the Sweden Democrats.
Compared with the 2022 parliamentary election, the “other parties” group noted a statistically significant net gain of about 0.4. percent from the Sweden Democrats.
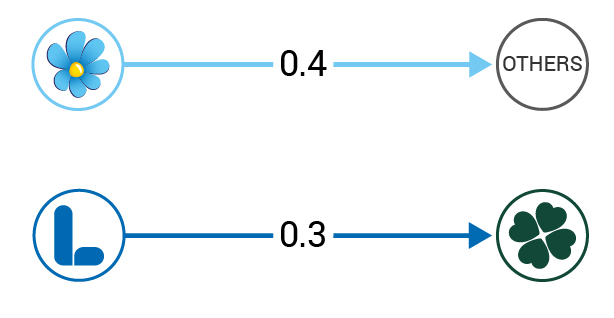
* Figure 1 illustrates statistically significant net flows from May 2024 to May 2025 between the various parties. The figures indicate statistically significant net gains and net losses as a percentage of the electorate. The flows are based on all those who stated which party they would vote for or answered “do not know” when asked which party they would vote for in an election in each survey round. The flows cannot be used to calculate total changes in parties’ proportion of voters compared with May 2024, because only statistically significant flows are presented and because there are flows between parties and the “do not know” group. (Unweighted information is available in table 22 in the publication that is published on 11 June.)
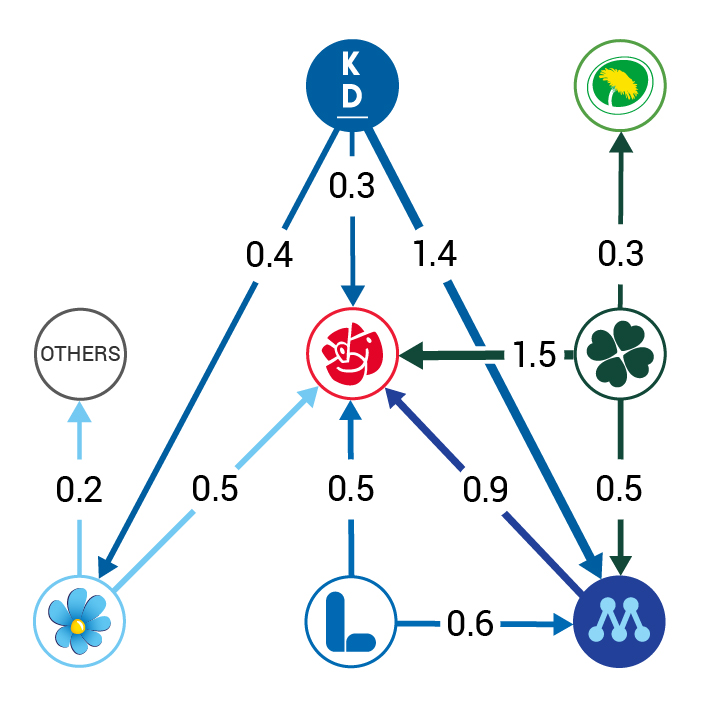
* Figure 2 illustrates statistically significant net flows in the electorate from the 2022 parliamentary election to May 2025 between the different political parties. The figures indicate statistically significant net gains and net losses as a percentage of the electorate. The flows are based on the answers of all the respondents in the survey who stated which party they voted for in the 2022 parliamentary election and which party they would vote for in an election in May 2025. The flows cannot be used to calculate total changes in parties’ proportion of voters compared with the 2022 election, because only statistically significant flows are presented and because there are flows between parties and the “do not know” group. (Unweighted information is available in table 21 in the publication that is published on 11 June.)
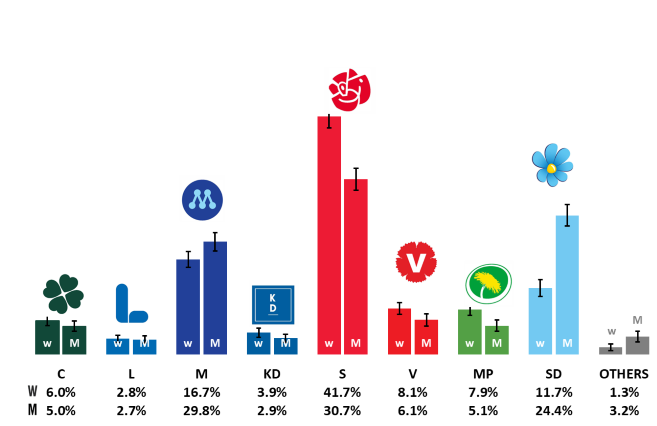
Estimate of election results “if an election had been held today”, women (W) and men (M). May 2025
| Party | Women | Men | Total | ||||
|---|---|---|---|---|---|---|---|
| Percent | Margin of error | Percent | Margin of error | Percent | Margin of error | ||
| C | 6.0 | ±0.9 | 5.0 | ±0.9 | 5.5 | ±0.6 | |
| L | 2.8 | ±0.6 | 2.7 | ±0.6 | 2.8 | ±0.4 | |
| M | 16.7 | ±1.4 | 19.8 | ±1.6 | 18.3 | ±0.9 | |
| KD | 3.9 | ±0.8 | 2.9 | ±0.7 | 3.4 | ±0.5 | |
| S | 41.7 | ±2.0 | 30.7 | ±1.9 | 36.2 | ±1.2 | |
| V | 8.1 | ±1.0 | 6.1 | ±1.1 | 7.1 | ±0.7 | |
| MP | 7.9 | ±1.0 | 5.1 | ±1.0 | 6.5 | ±0.7 | |
| SD | 11.7 | ±1.5 | 24.4 | ±1.9 | 18.0 | ±1.0 | |
| others | 1.3 | ±0.6 | 3.2 | ±0.9 | 2.3 | ±0.5 | |
Definitions and explanations
The Political Party Preference Survey in May 2025 was conducted with a national random sample consisting of 9 247 persons entitled to vote in a parliamentary election, without any upper age limit. Answers from these people are collected through telephone interviews and online questionnaires. As in previous surveys, all available telephone numbers, both to mobile phones and fixed phones, have been used to contact the selected persons.
Among the sample persons, 27.0 percent could not be reached, 2.3 percent were unable to participate, and 21.0 percent did not wish to be participate. The total non-response rate was 50.3 percent. The total number of respondents was 4 595, which corresponds to 49.7 percent. A more detailed presentation of the non-response is available in the survey’s Quality declaration.
The data was collected during the period from 29 April to 28 May.
The results are presented in the form of point estimates ± margins of uncertainty. The interval that is formed by the percent estimate ± margin of error here is a 95 percent uncertainty interval, which is an interval that, with 95 percent confidence, includes the actual value of the population, if no systematic errors occur.
Next publishing will be
On 11 June, information about political party preferences in May 2025 will be published, in total and by demographic group. Statistics Sweden has opted to split up the Political Party Preference Survey results to make it possible to publish “Election today estimate” as quickly as possible after completed data collection, and also to make it clear that there are two different measurements involved. “Election today estimate” is measured using the question “Which party would you vote for if a parliamentary election was held in the next few days?” while the political party preference is measured using the questions “Do you prefer one of the political parties more than the others?” and “Which party do you prefer the most?”.
The publication on 11 June also contains information about EU and euro preferences, in total and by demographic group, and NATO preferences.
Feel free to use the facts from this statistical news but remember to state Source: Statistics Sweden.