Party Preference Survey in (PSU) May 2026 – Election today
Political Party Preference Survey, May 2026
Statistical news from Statistics Sweden 2026-06-04 8.00
The Political Party Preference Survey presents election results if a parliamentary election were held in May 2026, as well as changes since May 2025 and since the 2022 parliamentary election.
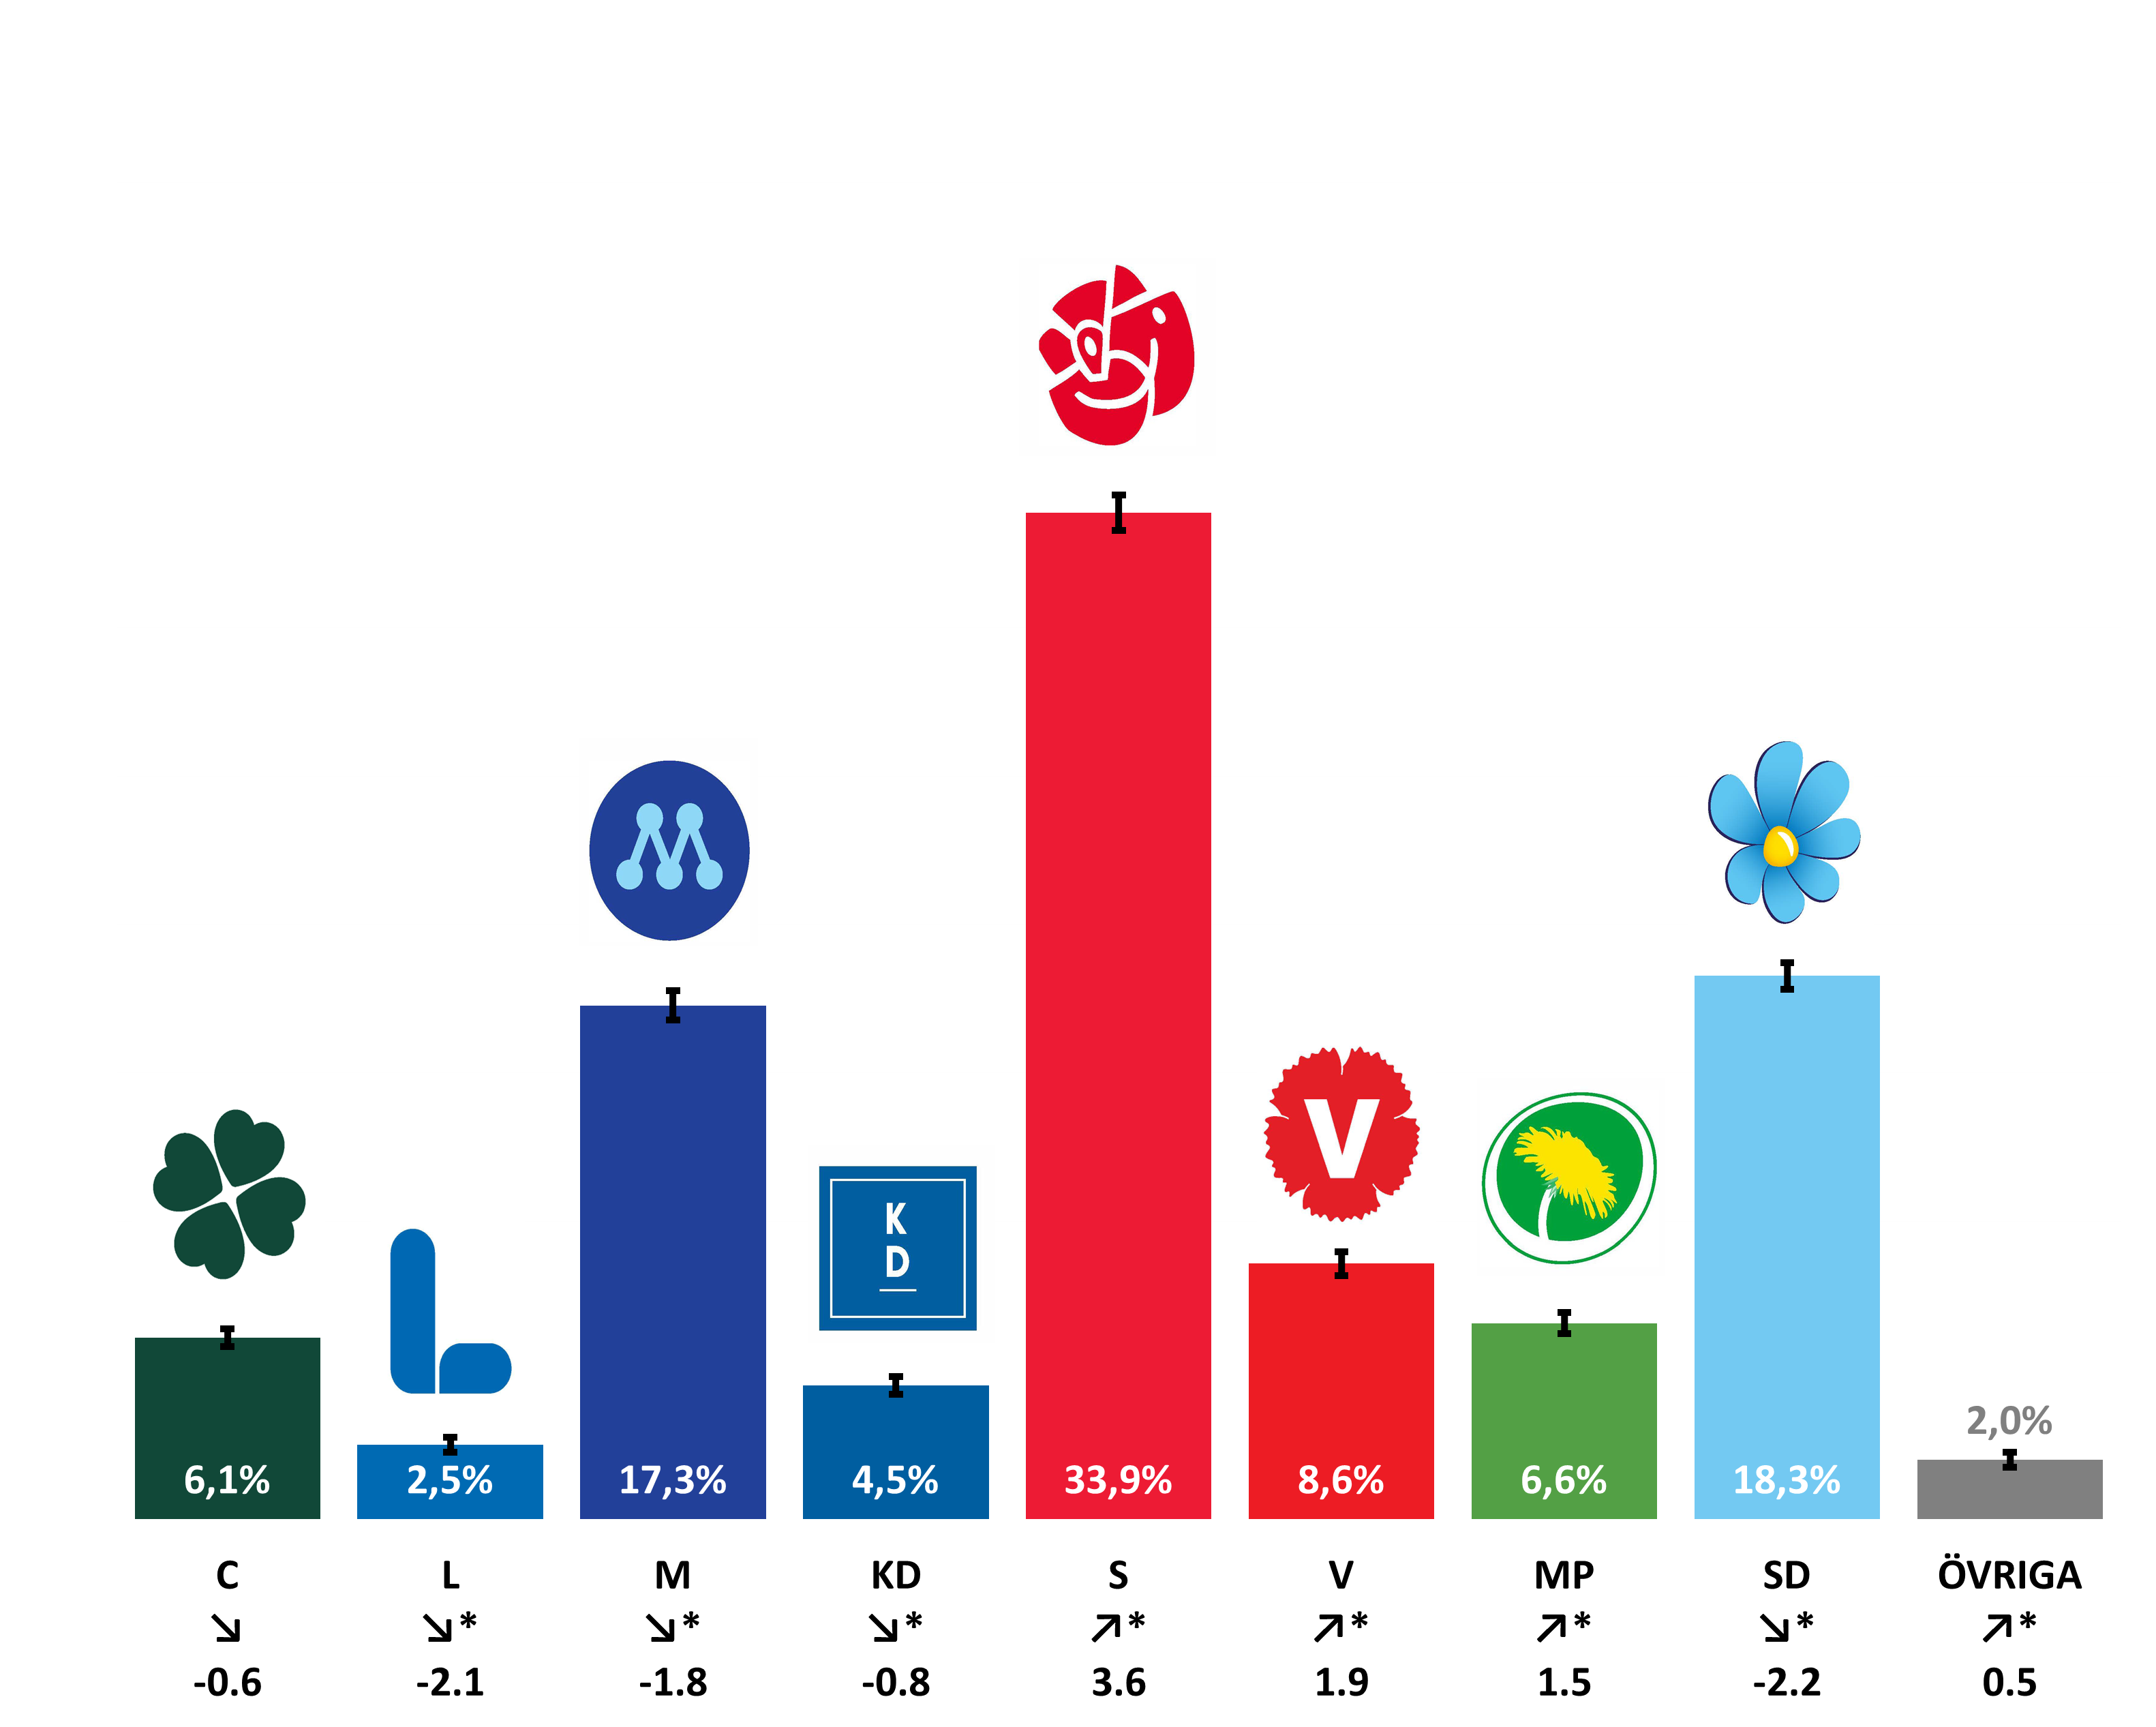
In an election in May 2026, the votes would be cast as follows (percentage and margin of uncertainty).
Social Democratic Party (S): 33.9 percent ± 1.2 percentage point
Sweden Democrats (SD): 18.3 percent ± 0.9 percentage point
Moderate Party (M): 17.3 percent ± 1.0 percentage point
Left Party (V): 8.6 percent ± 0.8 percentage point
Green Party (MP): 6.6 percent ± 0.7 percentage point
Centre Party (C): 6.1 percent ± 0.6 percentage point
Christian Democrats (KD): 4.5 percent ± 0.6 percentage point
Liberal Party (L): 2.5 percent ± 0.5 percentage point
Other parties: 2.0 percent ± 0.5 percentage point
The proportion of those in the electorate who were undecided was 19.6 percent (± 1.3 percentage points) in May 2026.
Estimate of election results “if an election had been held today”
The table below presents estimates of the political parties in May 2026, in May 2025, and the latest election results. The table also shows changes from the May 2025 survey results and the 2022 parliamentary election. Statistically significant changes are marked with an asterisk (*).
Estimate of election results “if an election had been held today”
|
Party |
Estimate May 2026 |
Estimate May 2025 |
Change since May 2025 |
Election 2022 |
Change since election 2022 |
||
|---|---|---|---|---|---|---|---|
|
|
Percent |
Margin of |
Percent |
Margin of |
|
|
|
C |
6.1 |
±0,6 |
5.5 |
±0,6 |
0.6 |
6.7 |
-0.6 |
L |
2.5 |
±0,5 |
2.8 |
±0,4 |
-0.3 |
4.6 |
-2.1* |
M |
17.3 |
±1,0 |
18.3 |
±0,9 |
-1.0 |
19.1 |
-1.8* |
KD |
4.5 |
±0,6 |
3.4 |
±0,5 |
1.1* |
5.3 |
-0.8* |
S |
33.9 |
±1,2 |
36.2 |
±1,2 |
-2.3* |
30.3 |
3.6* |
V |
8.6 |
±0,8 |
7.1 |
±0,7 |
1.5* |
6.7 |
1.9* |
MP |
6.6 |
±0,7 |
6.5 |
±0,7 |
0.1 |
5.1 |
1.5* |
SD |
18.3 |
±0,9 |
18.0 |
±1,0 |
0.3 |
20.5 |
-2.2* |
Other parties |
2.0 |
±0,5 |
2.3 |
±0,5 |
-0.3 |
1.5 |
0.5* |
The political parties in May 2026
Changes in all political parties compared with the May 2026 survey and the September 2022 parliamentary election are described below. The flow of voters between the political parties is also described below as a percentage of the electorate. Only statistically significant flows of voters are presented.
Centre Party
If an election were held in May 2026, the Centre Party would receive 6.1 ± 0.6 percent of the votes. This is not a statistically significant change compared with May 2025 or compared with the 2022 parliamentary election.
Compared with May 2025, the Centre Party has a statistically significant net gain of about 0.3 percent from the Liberal Party.
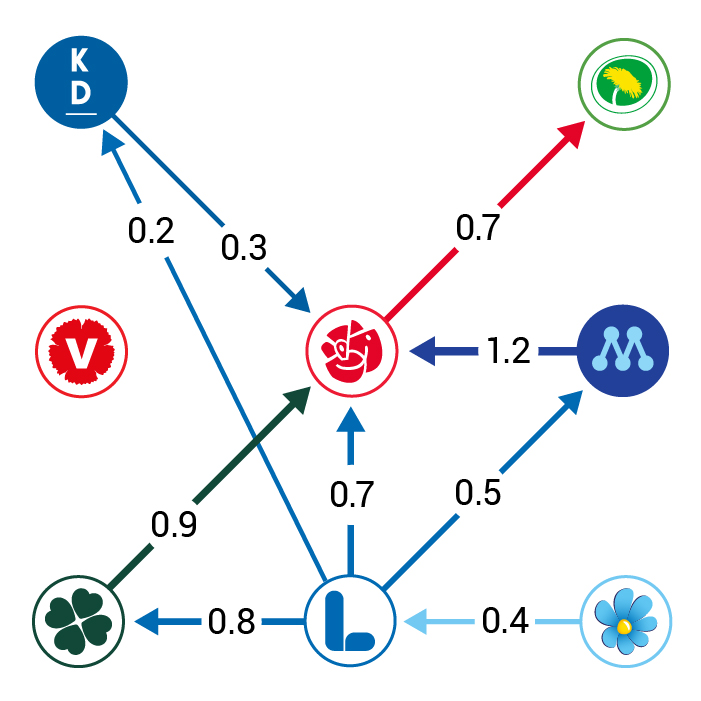
In relation to the 2022 parliamentary election, the Centre Party has a statistically significant net gain of about 0.8 percent from the Liberal Party and a net loss of about 0.9 percent to the Social Democratic Party.
Liberal Party
The Liberal Party would receive 2.5 ± 0.5 percent of the votes in an election in May 2026. This is not a statistically significant change compared with May 2025, but a statistically significant decrease compared with the 2022 parliamentary election.
Compared with May 2025, the Liberal Party has a statistically significant net gain of about 0.3 percent from the Sweden Democrats and a net loss of about 0.3 percent to the Centre Party.
In relation to the 2022 parliamentary election, the Liberal Party has one statistically significant net gain of about 0.4 percent from the Sweden Democrats, and at the same time net losses of about 0.8 to the Centre Party, 0.7 percent to the Social Democratic Party, 0.5 percent to the Moderate Party, and 0.2 percent to the Christian Democrats.
Moderate Party
If an election were held in May 2026, the Moderate Party would receive 17.3 ± 1.0 percent of the votes. This is not a statistically significant change compared with May 2025, while it is a statistically significant decrease compared with the 2022 parliamentary election.
Compared with May 2025, the Moderate Party has one statistically net loss of about 0.5 percent to the Christian Democrats.
Compared with the 2022 parliamentary election, the Moderate Party has one statistically significant net gain of about 0.5 percent from the Liberal Party, and one net loss of about 1.2 percent to the Social Democratic Party.
Christian Democrats
The Christian Democrats would receive 4.5 ± 0.6 percent of the votes in an election in May 2026. This is a statistically significant increase compared with May 2025, while it is not a statistically significant change compared with the 2022 parliamentary election.
Compared with May 2025, the Christian Democrats has statistically significant net gains of about 0.5 percent from the Moderate Party and of about 0.2 percent from the Social Democratic Party.
In relation to the 2022 parliamentary election, the Christian Democrats noted statistically significant one net gain of about 0.2 percent from the Liberal Party, and one net loss of about 0.3 percent to the Social Democratic Party.
Social Democratic Party
The Social Democratic Party would receive 33.9 ± 1.2 percent of the votes in an election in May 2026. This is a statistically significant decrease compared with May 2025, while it is a statistically significant increase compared with the 2022 parliamentary election.
Compared with May 2025, the Social Democratic Party has statistically significant net losses of about 0.7 percent to the Left Party and of about 0.2 percent to Christian Democrats.
In relation to the 2022 parliamentary election, there are statistically significant net gains noted of about 1.2 percent from the Moderate Party, about 0.9 from the Centre Party, about 0.7 percent from the Liberal Party, of about 0.3 percent from the Christian Democrats, and at the same time one statistically significant net loss of about 0.7 to the Green Party.
Left Party
If an election were held in May 2026, the Left Party would receive 8.6 ± 0.8 percent of the votes. This is a statistically significant increase compared with May 2025 and compared with the 2022 parliamentary election.
Compared with May 2025, the Left Party noted a statistically significant net gain of about 0.7 from the Social Democratic Party.
Green Party
If an election were held in May 2026, the Green Party would receive 6.6 ± 0.7 percent of the votes. This is not a statistically significant change compared with May 2025, while it is a statistically significant increase compared with the 2022 parliamentary.
Compared with the 2022 parliamentary election, the Green Party noted a statistically significant net gain of about 0.7 percent from the Social Democratic Party.
Sweden Democrats
The Sweden Democrats would receive 18.3 ± 0.9 percent of the votes in an election in May 2026. This is not a statistically significant change compared with both May 2025, while it is a statistically significant decrease compared with the 2022 parliamentary election.
The Sweden Democrats has compared with May 2025 a statistically significant net gain of about 1.3 percent from the “do not know” group, and at the same time a statically net loss of about 0.3 percent to the Liberal Party.
Compared with the 2022 parliamentary election, the Sweden Democrats noted statistically significant net loss of about 0.4 percent to the Liberal Party.
Other parties
The “other parties” group would receive 2.0 ± 0.5 percent of the votes in an election in May 2026. This is not a statistically significant change compared with both May 2025, while it is a statistically significant increase compared with the 2022 parliamentary election.
The “other parties” group has no statically significant net flows compared with May 2025 or in relation to the 2022 parliamentary election.
Net flows
Figure 1 Net flows from May 2025 to May 2026
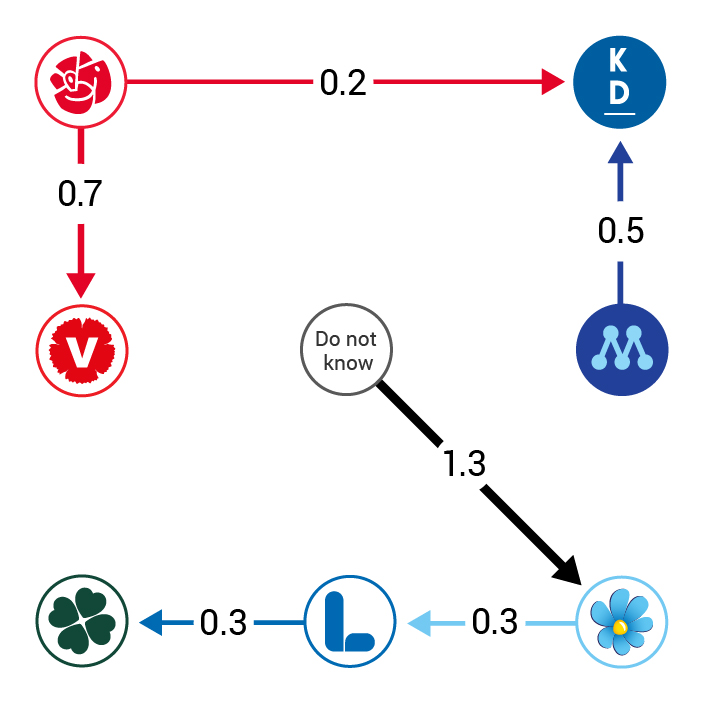
Figure 2 Net flows from the 2022 parliamentary election to May 2026
Estimate of election results “if an election had been held today”
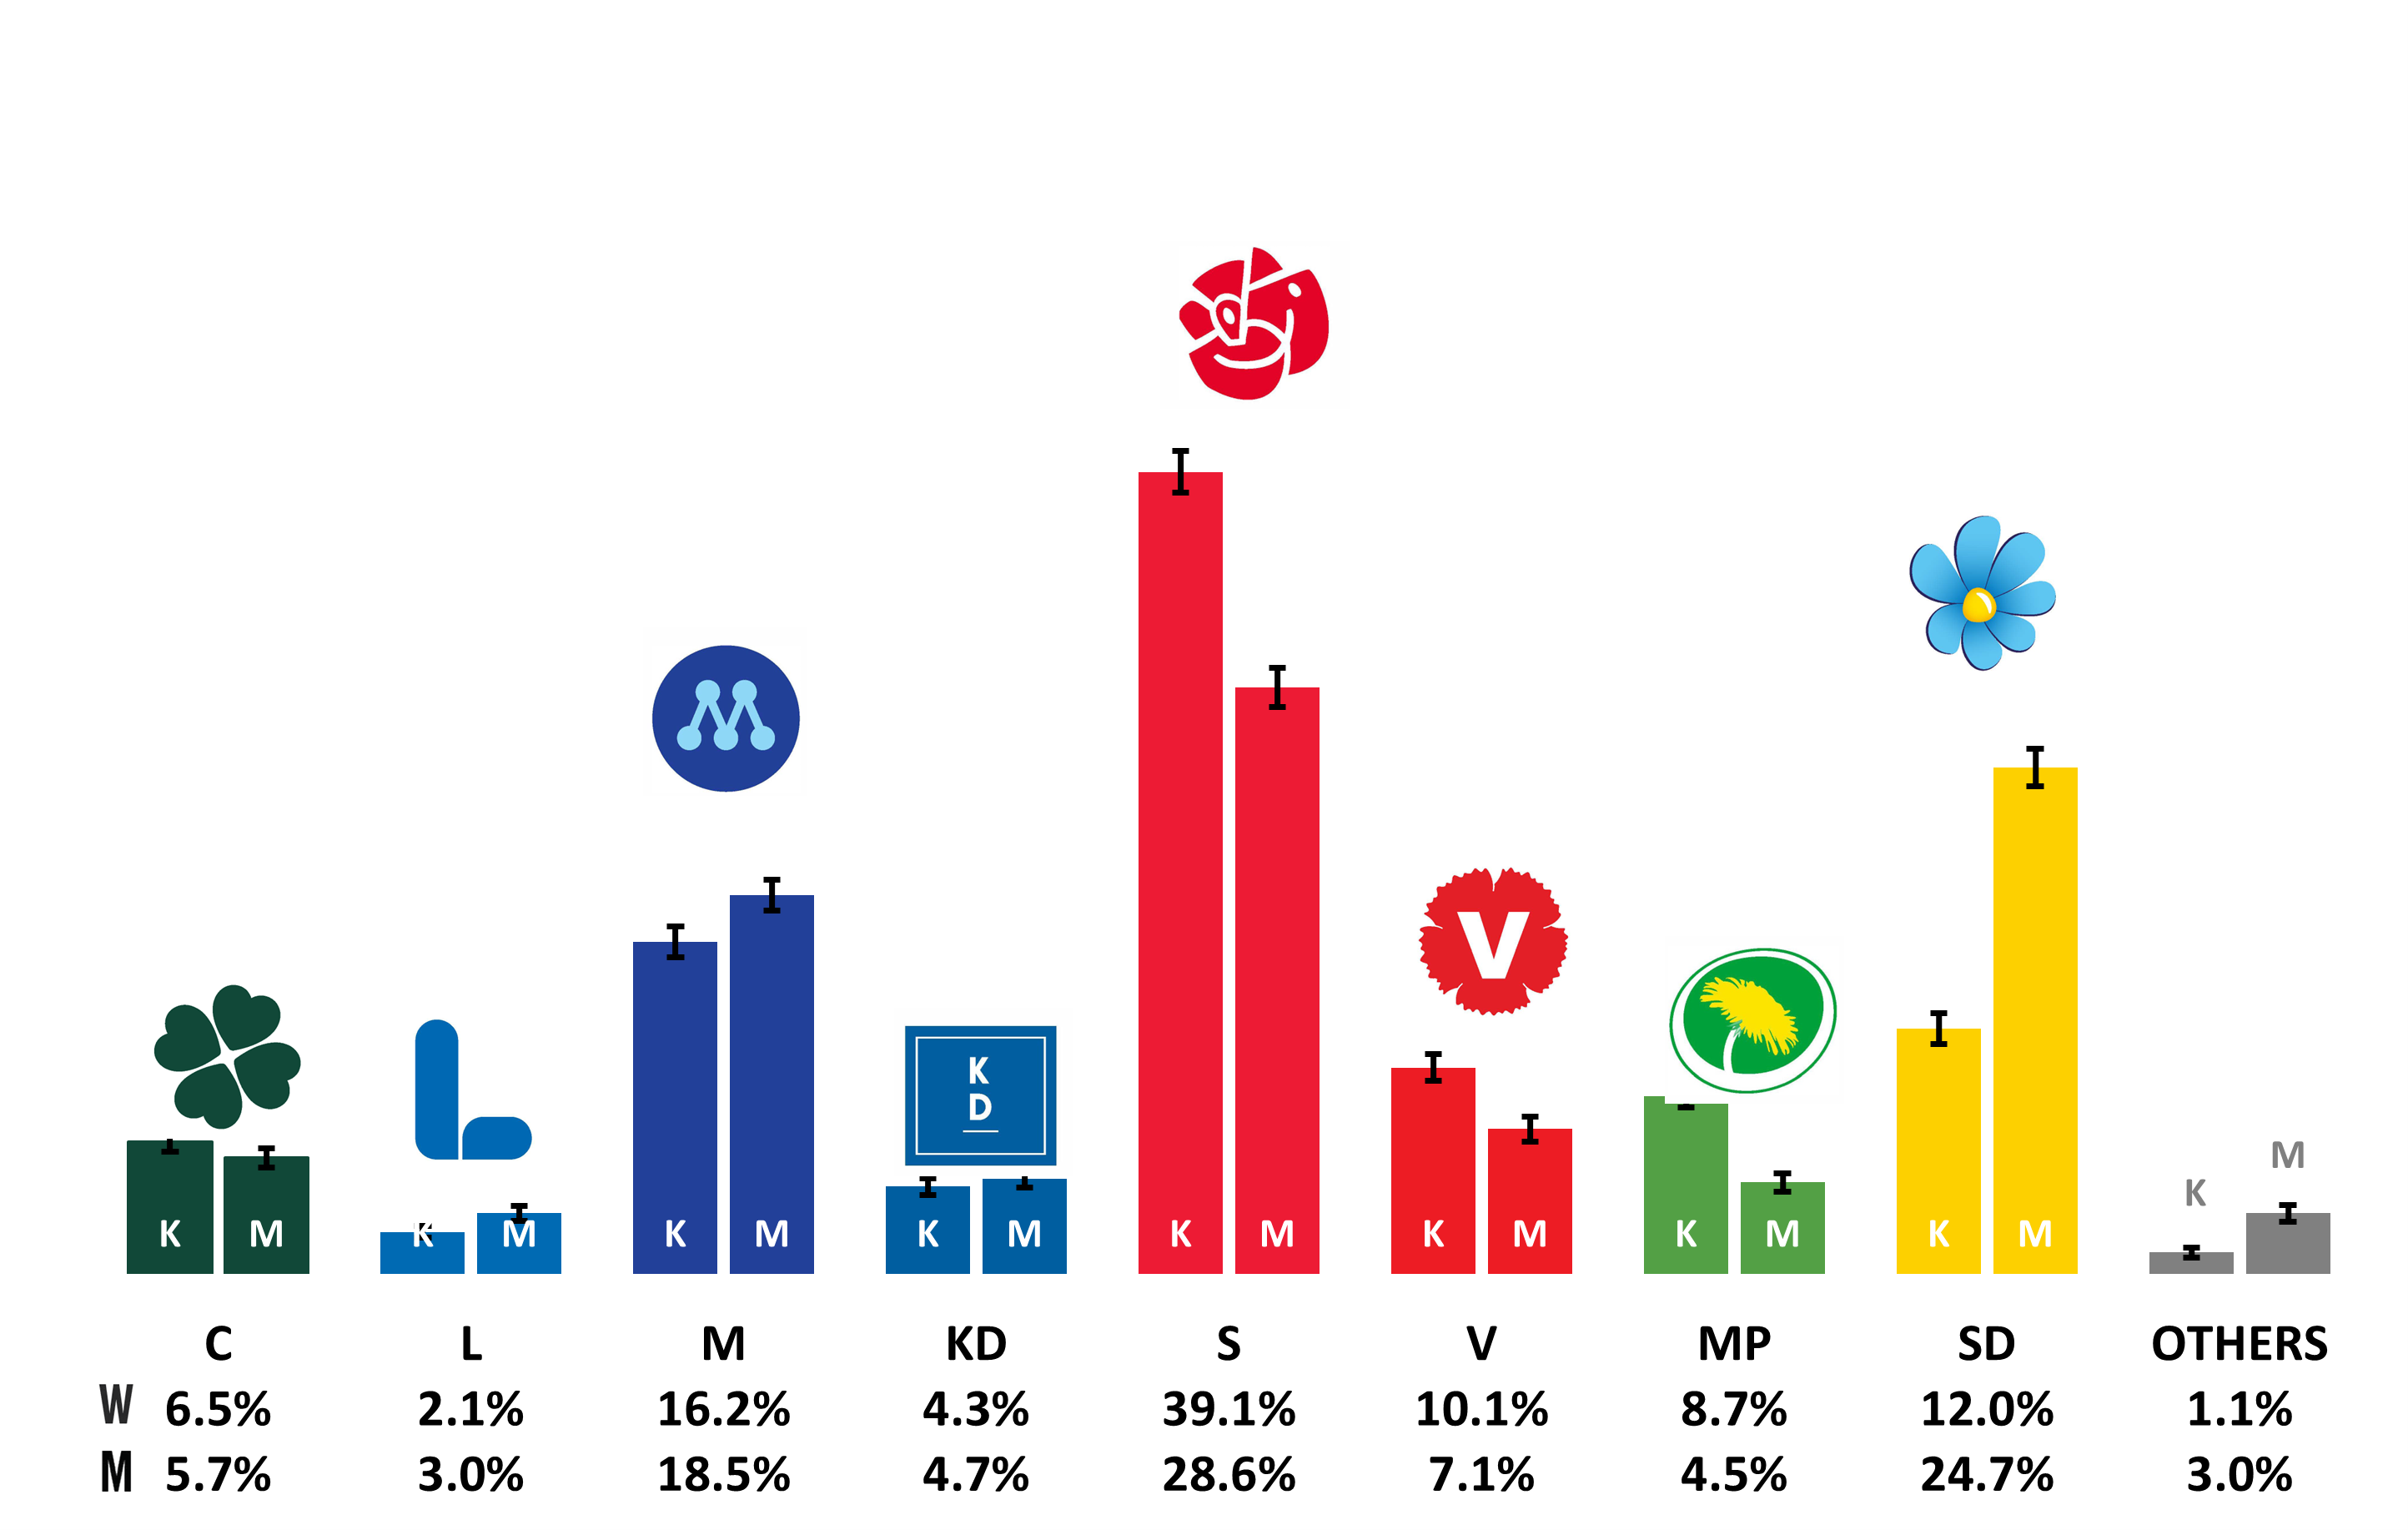
Estimate of election results “if an election had been held today”
|
Women |
Men |
Total |
|||
|
Percent |
Margin of uncertainty |
Percent |
Margin of uncertainty |
Percent |
Margin of uncertainty |
C |
6.5 |
±1.0 |
5.7 |
±0.9 |
6.1 |
±0.6 |
L |
2.1 |
±0.6 |
3.0 |
±0.7 |
2.5 |
±0.5 |
M |
16.2 |
±1.5 |
18.5 |
±1.5 |
17.3 |
±1.0 |
KD |
4.3 |
±0.8 |
4.7 |
±0.9 |
4.5 |
±0.6 |
S |
39.1 |
±2.0 |
28.6 |
±1.9 |
33.9 |
±1.2 |
V |
10.1 |
±1.0 |
7.1 |
±1.1 |
8.6 |
±0.7 |
MP |
8.7 |
±1.1 |
4.5 |
±0.9 |
6.5 |
±0.7 |
SD |
12.0 |
±1.5 |
24.7 |
±1.8 |
18.3 |
±0.9 |
Other parties |
1.1 |
±0.5 |
3.0 |
±0.8 |
2.0 |
±0.5 |
Definitions and explanations
Definitions and explanations
The Political Party Preference Survey in May 2026 was conducted with a national random sample consisting of 9 260 persons entitled to vote in a parliamentary election, without any upper age limit. Answers from these people are collected through telephone interviews and online questionnaires. As in previous surveys, all available telephone numbers, both to mobile phones and fixed phones, have been used to contact the selected persons.
Among the sample persons, 29.0 percent could not be reached, 2.2 percent were unable to participate, and 19.7 percent did not wish to be participate. The total non-response rate was 51.0 percent. The total number of respondents was 4 542, which corresponds to 49.0 percent. A more detailed presentation of the non-response is available in the survey’s Quality declaration.
The data was collected during the period from 28 April to 28 May.
The results are presented in the form of point estimates ± margins of uncertainty. The interval that is formed by the percent estimate ± margin of error here is a 95 percent uncertainty interval, which is an interval that, with 95 percent confidence, includes the actual value of the population, if no systematic errors occur.
Changes for users retrieving information with the help of an API
In the fall of 2025, PxWebApi v1 was replaced by PxWebApi v2. PxWebApi v1 will remain up and running until, 31 December 2026, but will after that no longer be functional. For more information and instructions on conversion, please see PxWebApi v2
Comments
The change refers to a comparison with the 2022 parliamentary election in percentage points.