Innovation in the Government Sector 2021–2022
Five out of ten workplaces in the Government sector were innovation active in 2021–2022
Statistical news from Statistics Sweden 2023-11-16 8.00
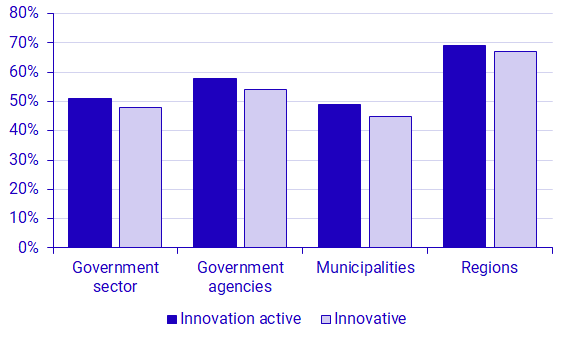
In total, 51 percent of workplaces in the Government sector were innovation active during 2021–2022. The largest share of innovation active workplaces was found in the regions, with 69 percent. Among non-innovation active workplaces during the period, a majority reported that they had no need for innovation activities.
During the period 2021–2022, 48 percent of workplaces in the Swedish Government sector were innovative. Workplaces under regions were the most innovative, 67 percent, followed by workplaces in government agencies, 54 percent. Among municipal workplaces, which is the largest group, the share of innovative workplaces amounted to 45 percent during 2021–2022. The share of innovation active workplaces was similar to the share of innovative workplaces in all sub-sectors. In total, 51 percent of workplaces were innovation active during 2021–2022. This entails that few workplaces conducted innovation activities without at least some of them resulting in innovation.
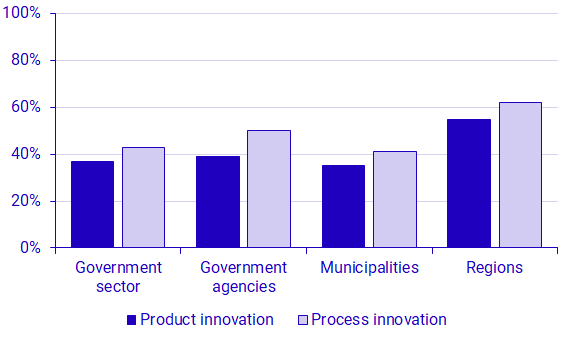
Most common during 2021-2022 was to have introduced a new or significantly improved process, with 43 percent. The share of workplaces that introduced at least one new or significantly improved product (good or service) during the period amounted to 37 percent. Process innovation being more common than product innovation was the case for all sub-sectors, but the difference was largest for workplaces in government agencies where the share of process innovative workplaces exceeded the share of product innovative workplaces by 11 percentage points. For municipal and regional workplaces, the corresponding difference was 6 and 7 percentage points respectively.
Reasons not to conduct more or any innovation activities
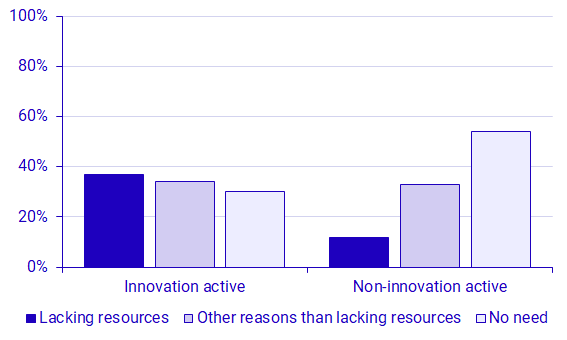
Among non-innovative workplaces during 2021-2022, the most common reason for not conducting innovation activities was that the workplace saw no need. In total, 54 percent of all non-innovation active workplaces gave this as the main reason for not conducing innovation activities. At the same time, 12 percent of non-innovative workplaces saw lacking resources as the main reason to not conduct innovation activities while 33 percent found other reasons than lacking resources as the main hinderance. This means that, while there is a need for innovation that cannot be satisfied due to a lack or resources or other reasons, in a majority of cases the lack of innovation activity is the natural effect of the workplace not finding innovation necessary.
Conditions among innovation active workplaces were found to be the opposite. The largest share, 37 percent, reported a lack of resources as the main reason for not conducting more innovation activities during the period. In this group, 30 percent reported that they did not see any need for more innovation activities while 34 percent reported other reasons than lacking resources. Thus, among workplaces that conducted some form of innovation activities during 2021-2022, lacking resources was perceived as a more prominent hinderance than among non-innovative workplaces.
Innovation with environmental benefits
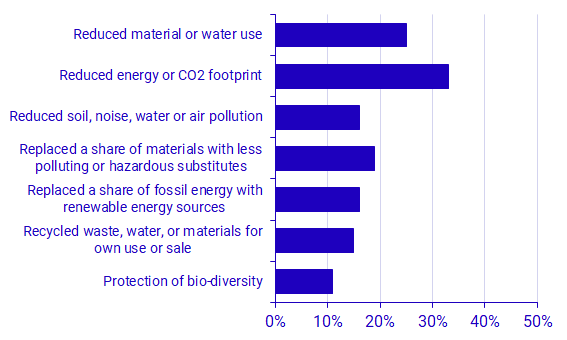
Of innovative workplaces, half reported that at least one of the workplace’s innovations had some form of environmental benefit. The most reported environmental benefit was reduced energy or CO2 footprint with 33 percent. Reduced material or water use was also a commonly acquired environmental benefit while innovation leading to protection of biodiversity was less reported. Only 11 percent of innovative workplaces acquired this environmental benefit from their innovations. The total share of workplaces that gained environmental benefits from at least one of their innovations was similar among government agencies and municipalities with 49 and 48 percent respectively while the corresponding share among the regions amounted to 64 percent.
Definitions and explanations
The survey, Innovation in the Government sector, is aimed at all workplaces in the Government sector in Sweden. This sector contains workplaces owned either by government agencies, regions, or municipalities. Workplaces owned by public corporations that act on a market are not included in the population.
An innovation is a new or improved product (good or service) or process that differs significantly from the workplace’s previous products or processes and that has been introduced to users or implemented in the workplace. New or significantly improved products obtained through procurement are also included.
Innovation activities include all developmental and financial activities undertaken by a workplace that are intended to result in an innovation. This includes activities aimed at improving the capacity for innovation as well as the introduction of new products or processes in the workplace either through own development or through procurement.
Innovation activities include:
- Developing ideas and initiatives from users or society
- Cooperation for innovation purposes
- Designing, developing, or testing new or improved products or processes
- Purchasing innovation through public procurement
- Conducting research and development (R&D)
- Handling intellectual properties (patents, licences, etc.)
Innovation in the Government sector has been conducted for the reference period 2021-2022 by Statistics Sweden by commission from Vinnova. Participation in the survey has been voluntary and the total response rate is 20 percent. The low response rate means that some statistics are very uncertain. All statistics included in this news item as well as in the statistical database are considered to be of sufficient quality.
Feel free to use the facts from this statistical news but remember to state Source: Statistics Sweden.