Household customers' switches of electricity suppliers in relation to certain price differences
The figure below illustrates the number of household customers who have switched electricity suppliers per quarter. As a comparison, the existing price difference is shown between the highest and lowest price with electricity suppliers for a 1-year contract for a customer in a detached house with electric heating. This customer category consumes a considerable amount of electricity and is usually more sensitive to price fluctuations.
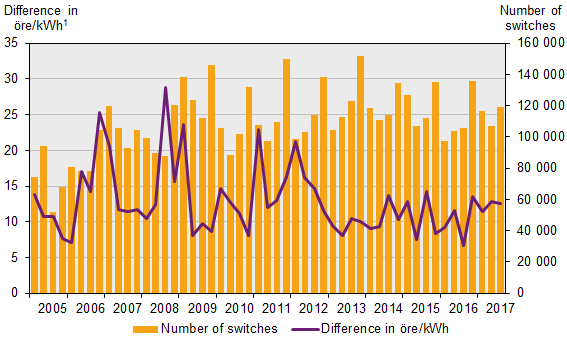
1) The difference between the highest and lowest price refer to the first day in respectively quarter.
More about the results
Source
Swedish Energy Agency
Last updated
2017-12-11