Income and taxes: Income distribution 1991–2023
Income inequality has increased since the 1990s
Statistical news from Statistics Sweden 2025-05-22 8.00
There has been a trend of increasing income inequality since 1991. The highest income groups have had a greater increase in income than the lowest groups. However, without capital income, the differences are smaller.
In a new report, Statistics Sweden describes the development of income inequality in Sweden since the beginning of the 1990s up to 2023, based on official income distribution statistics. Deciles and the Gini coefficient are examples of income distribution measures presented in the report.
Incomes have increased for all groups over a longer period of time. Between 1991 and 2023, the median value of the economic standard – measured as disposable income adjusted for household composition –increased by just over 60 percent for the population as a whole. The income figures have been adjusted for inflation by converting previous years to 2023 price levels.
But while the economic standard has increased, the differences also have grown. In other words, the increase in income has not been the same for all groups. One way to illustrate this is by looking at the changes within each income decile. Deciles divide the population into ten equally sized groups based on their level of economic standard. For decile 1, the group with the lowest economic standard, the average increased by 32 percent between 1991 and 2023, when all capital income is included. For decile 10, the increase was 127 percent. The chart below also shows the development for the top 1 percent of the population in terms of income (percentile 100). For this group, economic standard has increased by 224 percent since 1991.
"A clear pattern is that the increase for each decile is greater than for the one below it – that is, the higher up in the income distribution, the more incomes have increased", says Peter Gärdqvist at Statistics Sweden (SCB).

More even distribution without capital income
The Gini coefficient is a summary measure of the income distribution across the entire population. The coefficient ranges from 0 to 1, where a higher value indicates greater income inequality.
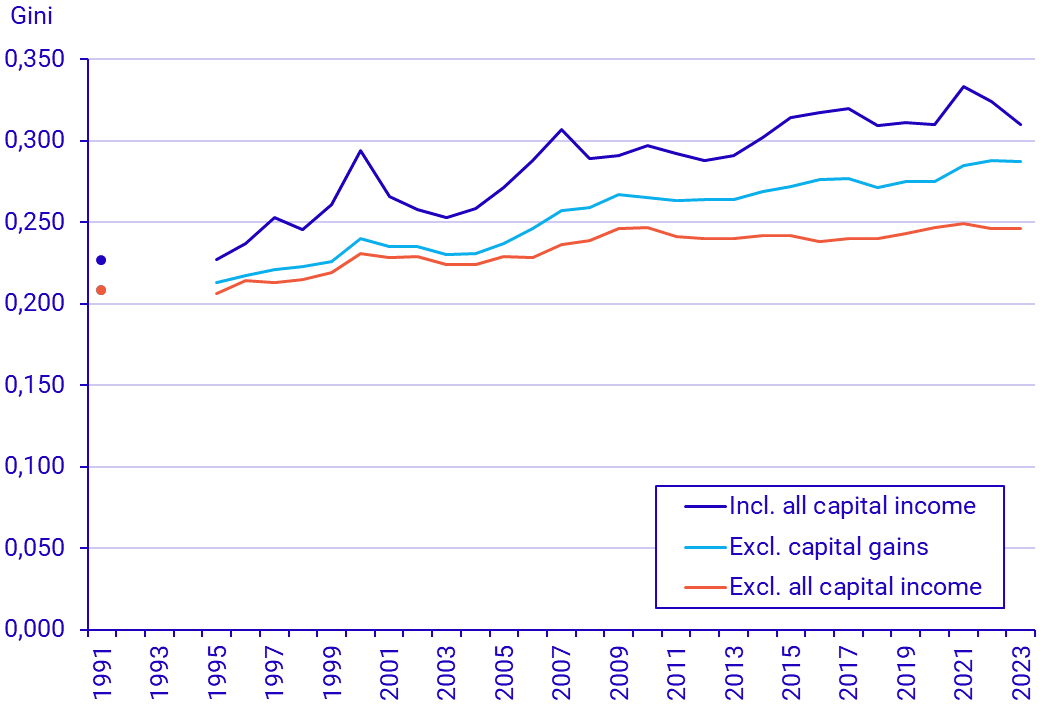
The Gini coefficient increased from 0.226 in 1991 to 0.310 in 2023. However, the increase has occurred at varying rates during the period, as shown in the chart below. During the 1990s, income inequality increased until it reached a peak in 2000. After that, the increase leveled off. In the second half of the 2000s, income inequality rises again noticeably, before slowing down somewhat.
Realized capital gains, such as from the sale of housing and securities, as well as other forms of capital income, play a significant role in income disparities. Income is more unevenly distributed if capital income is included. This is because a large share of capital income goes to a small portion of the population at the top of the income distribution.
Income disparities have also increased more when capital income is included, which means that these types of income have contributed more to the development than, for example, salary income.
"When it comes to overall income disparities, not much has changed after 2009 if capital income is excluded", says Peter Gärdqvist.
Definitions and explanations
Economic standard: To compare disposable income between different types of households, the household´s disposable income is adjusted based on the number of adults and children in the household.
Disposable income refers to the total of all taxable and non-taxable income, minus taxes and other negative transfers (such as repaid study loans) for all household members.
Gini coefficient: The Gini coefficient is used to measure inequality in income distribution. It ranges from 0 to 1, where a higher value indicates greater inequality.
Fixed prices: Income and economic standard for years prior to 2023 have been adjusted to the 2023 price level using the Consumer Price Index (CPI).
Publication
A more detailed report of this survey is published in the publication: Income distribution 1991–2023 (pdf, in Swedish)
Statistical Database
More information is available in the Statistical Database
Feel free to use the facts from this statistical news but remember to state Source: Statistics Sweden.