Densification and depopulation of localities 2005-2025
Increasing population density in Sweden’s urban areas and localities
Statistical news from Statistics Sweden 2026-03-25 8.00
The total population living in Sweden’s urban areas and localities has increased steadily over the past 20 years. This is due both to the outward expansion of these areas, and to a higher residential density within older housing areas. Urban areas and localities with fewer than 10,000 inhabitants have shown greater variation in population trends.
Statistics Sweden updates the extent of the statistical localities every five years, with an additional mid‑period edition starting in 2018. This publication presents the annual population figures within each edition of localities, beginning with those referring to the year 2000. This means that population figures are reported annually within seven different editions of locality boundaries, each reflecting conditions in a specific year. Combined with information on the land area of the localities, the data provide an indication of whether these areas are becoming more densely or more sparsely populated.
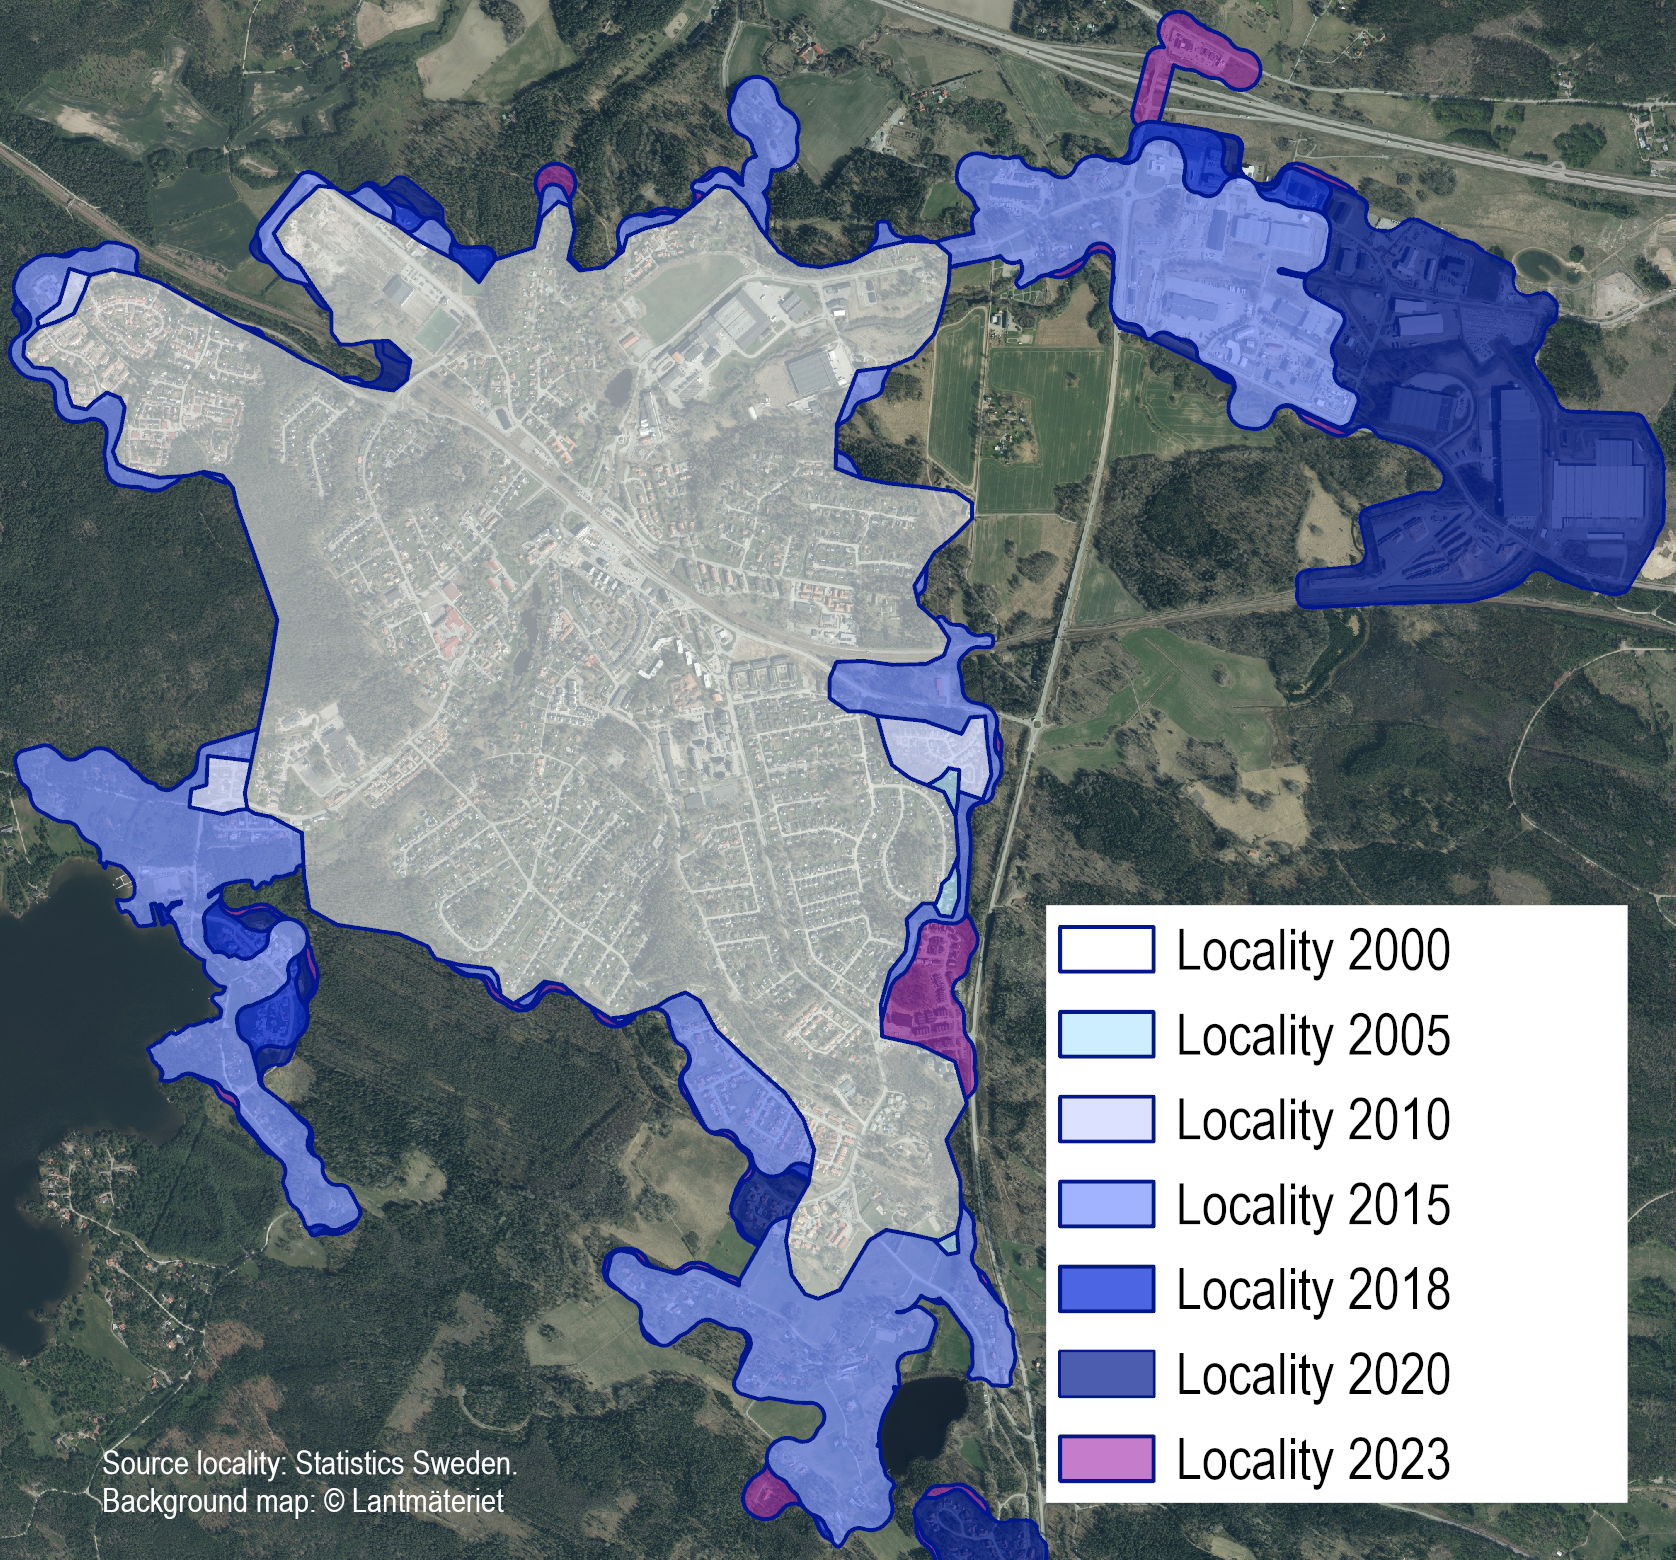
Locality boundary 2000 with extensions in each new edition up to and including 2023
Steady increase in the population of urban areas and localities
The total population living in Sweden’s urban areas and localities has increased steadily over the past 20‑year period. At the same time, the total area of these areas has expanded with each new edition, although at a slower pace than the population. In 2005, the population ranged between 7.6 and 7.8 million, depending on which edition of localities was applied in the calculation. By 2025, the population in urban areas and localities had grown to 8.6 million in the 2000 edition and 9.3 million in the 2023 edition. Over this period, the differences in population between the editions increased. In 2005, the difference between the oldest and newest edition amounted to 190,000 people, while in 2025 the difference was nearly 671,000 people.
Population in urban areas and localities by edition (locality reference year), 2005–2025
Density increasing across all editions of localities
The number of inhabitants per square kilometre is a measure of population density. According to all editions of the statistical localities, population density has increased over the past twenty‑year period. Since the land area is constant for each edition throughout the entire period from 2005 to 2025, population density has increased in line with population growth. The lower density figures in earlier years—particularly for the more recent editions of localities—are partly due to the fact that they include areas that had not yet been developed with housings at the beginning of the time series. The increase in population density in the older editions is due to new housing being constructed within already developed areas, or to an increase in the number of inhabitants living in older housing.
The difference in population density between the more recent and older editions of localities—with a clear discontinuity between the 2010 and 2015 editions—is also due to a major methodological change introduced by Statistics Sweden in connection with the creation of the 2015 edition.
Population density in urban areas and localities by edition (locality reference year), 2005–2025
Smaller urban areas and localities show greater variation in population trends
The largest share of the population living in urban areas and localities resides in those with a high number of inhabitants. In the 2025 edition, more than 70 per cent of the urban‑area population lived in urban areas with more than 10,000 inhabitants. As a result, overall population trends in urban areas and localities are largely shaped by developments in the larger ones, which have shown a steady population increase across all seven editions included in this presentation.
The smaller urban areas and localities, with fewer than 10,000 inhabitants, show greater variation in population trends. The older editions, from 2000 to 2010, displayed a declining trend during much of the period between 2000 and 2025, with the exception of the years around 2015–2019. The more recent editions showed an increase in population up until around 2020, followed by a subsequent decline. This change may be due both to an actual population decrease within these urban areas and localities, and to the fact that some urban areas close to the 10,000‑inhabitant threshold have grown sufficiently to be reclassified into the size class above 10,000 inhabitants.
When the statistics are broken down into more detailed size classes or into individual urban areas and localities, greater variation in development becomes visible.
Population in urban areas and localities with fewer than 10,000 inhabitants, by edition (locality reference year), 2005–2025
Definitions and explanations
The statistics are based on Statistics Sweden’s data on statistical localities. A statistical locality is a built‑up area with at least 200 residents registered in the population register, characterised by dense development. The term “statistical locality” is used to emphasise that the statistics are based on a classification of areas derived from register data, geospatial data and statistical sources. Statistics Sweden’s localities may therefore differ from how other parts of society define and delineate localities in Sweden.
The term “urban area” is used to describe larger localities with an urban character. Statistics Sweden has not defined an exact boundary between urban areas and localities.
Statistics Sweden delineates the localities geographically and then compiles statistics for them. The density of the built-up areas is measured using geospatial data from Lantmäteriet, containing information on buildings, properties, roads and land. The maximum permitted distance between buildings depends on several factors, including the number of registered residents and employees in different parts of the locality. Information on population and employees is obtained from Statistics Sweden’s registers and combined with address information.
The boundaries of Statistics Sweden’s statistical localities are updated every five years. Starting in 2018, an additional mid‑period update is also produced. The most recent edition is based on data from 2023. The next update will reflect conditions in 2025, with publication planned for 26 November 2026.
Statistics on the population in urban areas and localities are published annually. The data show the annual population within each edition of statistical localities, beginning with the 2000 edition. Together with information on land area, this provides a measure of population density and an indication of whether the urban areas and localities are becoming more densely populated or more sparsely populated.