Regional Matching Indicators (RMI) 2024
Matching statistics now available at the municipal level
Statistical news from Statistics Sweden 2026-06-24 8.00
Statistics Sweden (SCB) annually publishes the Regional Matching Indicators (RMI), which highlight the supply and demand of educated labor at the regional level. The statistics also show how well individuals’ current occupations align with their educational background. The RMI is intended to serve as a support tool in regional efforts for skills provision. In several updated tables, data are now also presented at the municipal level to enable more detailed analyses.
SCB is working to gradually introduce the disclosure control method Cell Key Method (CKM) in the RMI tables. The method involves adding a small, controlled random variation to statistical values when they are produced. This makes it possible to present detailed statistics without having to suppress values (for example, with dots) or reduce the level of detail in the data. It enables the presentation of RMI statistics at a more detailed level, down to the municipal level, as well as the introduction of additional reporting variables.
Since last year, the indicator Matching – education (E3) has been available using CKM. This year, three existing indicators are republished using the disclosure control method:
- Job flows (E2)
- Matching – occupation (E5)
- Education flows (U3)
In all RMI tables that use CKM, statistics are presented for municipalities instead of the previously used, broader functional analysis regions (FA regions). In addition, new, more detailed reporting variables have been introduced, such as five-year age groups. The age range for the four indicators E2, E3, E5, and U3 has also been extended from 65 to 69 years, as an adaptation to changing retirement ages.
Right skills in the right place – how large a share has the appropriate education?
The indicator Matching – occupation (E5) refers to the match between occupation and education among employees aged 20–69. It shows to what extent employees’ current occupations correspond to their education.
A high share of employees with fully matching education within a given occupation indicates that the education system largely meets the labour market’s demand for skills. This relationship is particularly evident in so-called regulated professions, where there are formal requirements for education, licensing, or other forms of state authorization in order to practice the occupation.
With the exception of elected officials and politicians—where all levels and fields of education are considered fully matched in SCB’s matching assessments—as well as managers in finance and similar fields, the list of occupations with the highest shares of employees with fully matching education is dominated by licensed and other regulated professions.
Occupations with the highest share of employees with fully matching education, Sweden 2024
Occupation |
Share of fully matched employees |
Elected representatives |
100% |
Legislators, senior officials and chief executives |
100% |
Dentists |
99% |
Medical doctors |
98% |
Driving instructors and trainers |
97% |
Midwives |
97% |
Managers in finance, human resources, marketing and sales, and business services and administration |
97% |
University and higher education teachers |
97% |
Psychologists and psychotherapists |
97% |
Veterinarians |
97% |
In practice, however, it is difficult to measure a complete match between occupation and education, even within licensed professions. One reason may be that the employee is working in the occupation as part of their training and therefore has not yet completed their degree. Another important reason is that within all occupational groups there are individuals who do have an education corresponding to the occupation, but who also possess an additional qualification that is longer or at a higher level. In such cases, it is the latter qualification that is used in the matching assessment.
A low share of employees with fully matching education within a given occupation, on the other hand, may be due to the occupation lacking clear or established educational pathways, making it common for people to enter through experience, practical training, or shorter courses. This means that such occupations often have a broad recruitment base, where individuals with different types of backgrounds can work. This is also reflected in the list below of occupations with the lowest share of employees with fully matching education.
Occupations with the lowest share of employees with fully matching education, Sweden 2024
Occupation |
Share of fully matched employees |
Head waiters, waiters and bartenders |
14% |
Sports coaches and instructors, professional athletes, fitness instructors and health educators |
17% |
Leisure and recreation leaders |
21% |
Legal secretaries, executive secretaries and administrative secretaries |
24% |
Tailors, upholsterers and leather craft workers |
24% |
Veterinary nurses and assistants |
27% |
Agricultural and horticultural workers |
28% |
Bus and tram drivers, taxi drivers and car, motorcycle and bicycle drivers |
30% |
Prepress technicians, printers and bookbinders |
30% |
Butchers, bakers and food processing workers |
30% |
At the same time, a low share of matched individuals may also indicate skills shortages or recruitment difficulties. In such situations, employers may need to lower formal requirements or recruit individuals with educational backgrounds different from those normally sought.
Improved regional detail in matching statistics with CKM
Matching statistics from the indicator Matching – occupation (E5), using the disclosure control method CKM, are now available down to the municipal level. The same applies to all other RMI tables published using CKM.
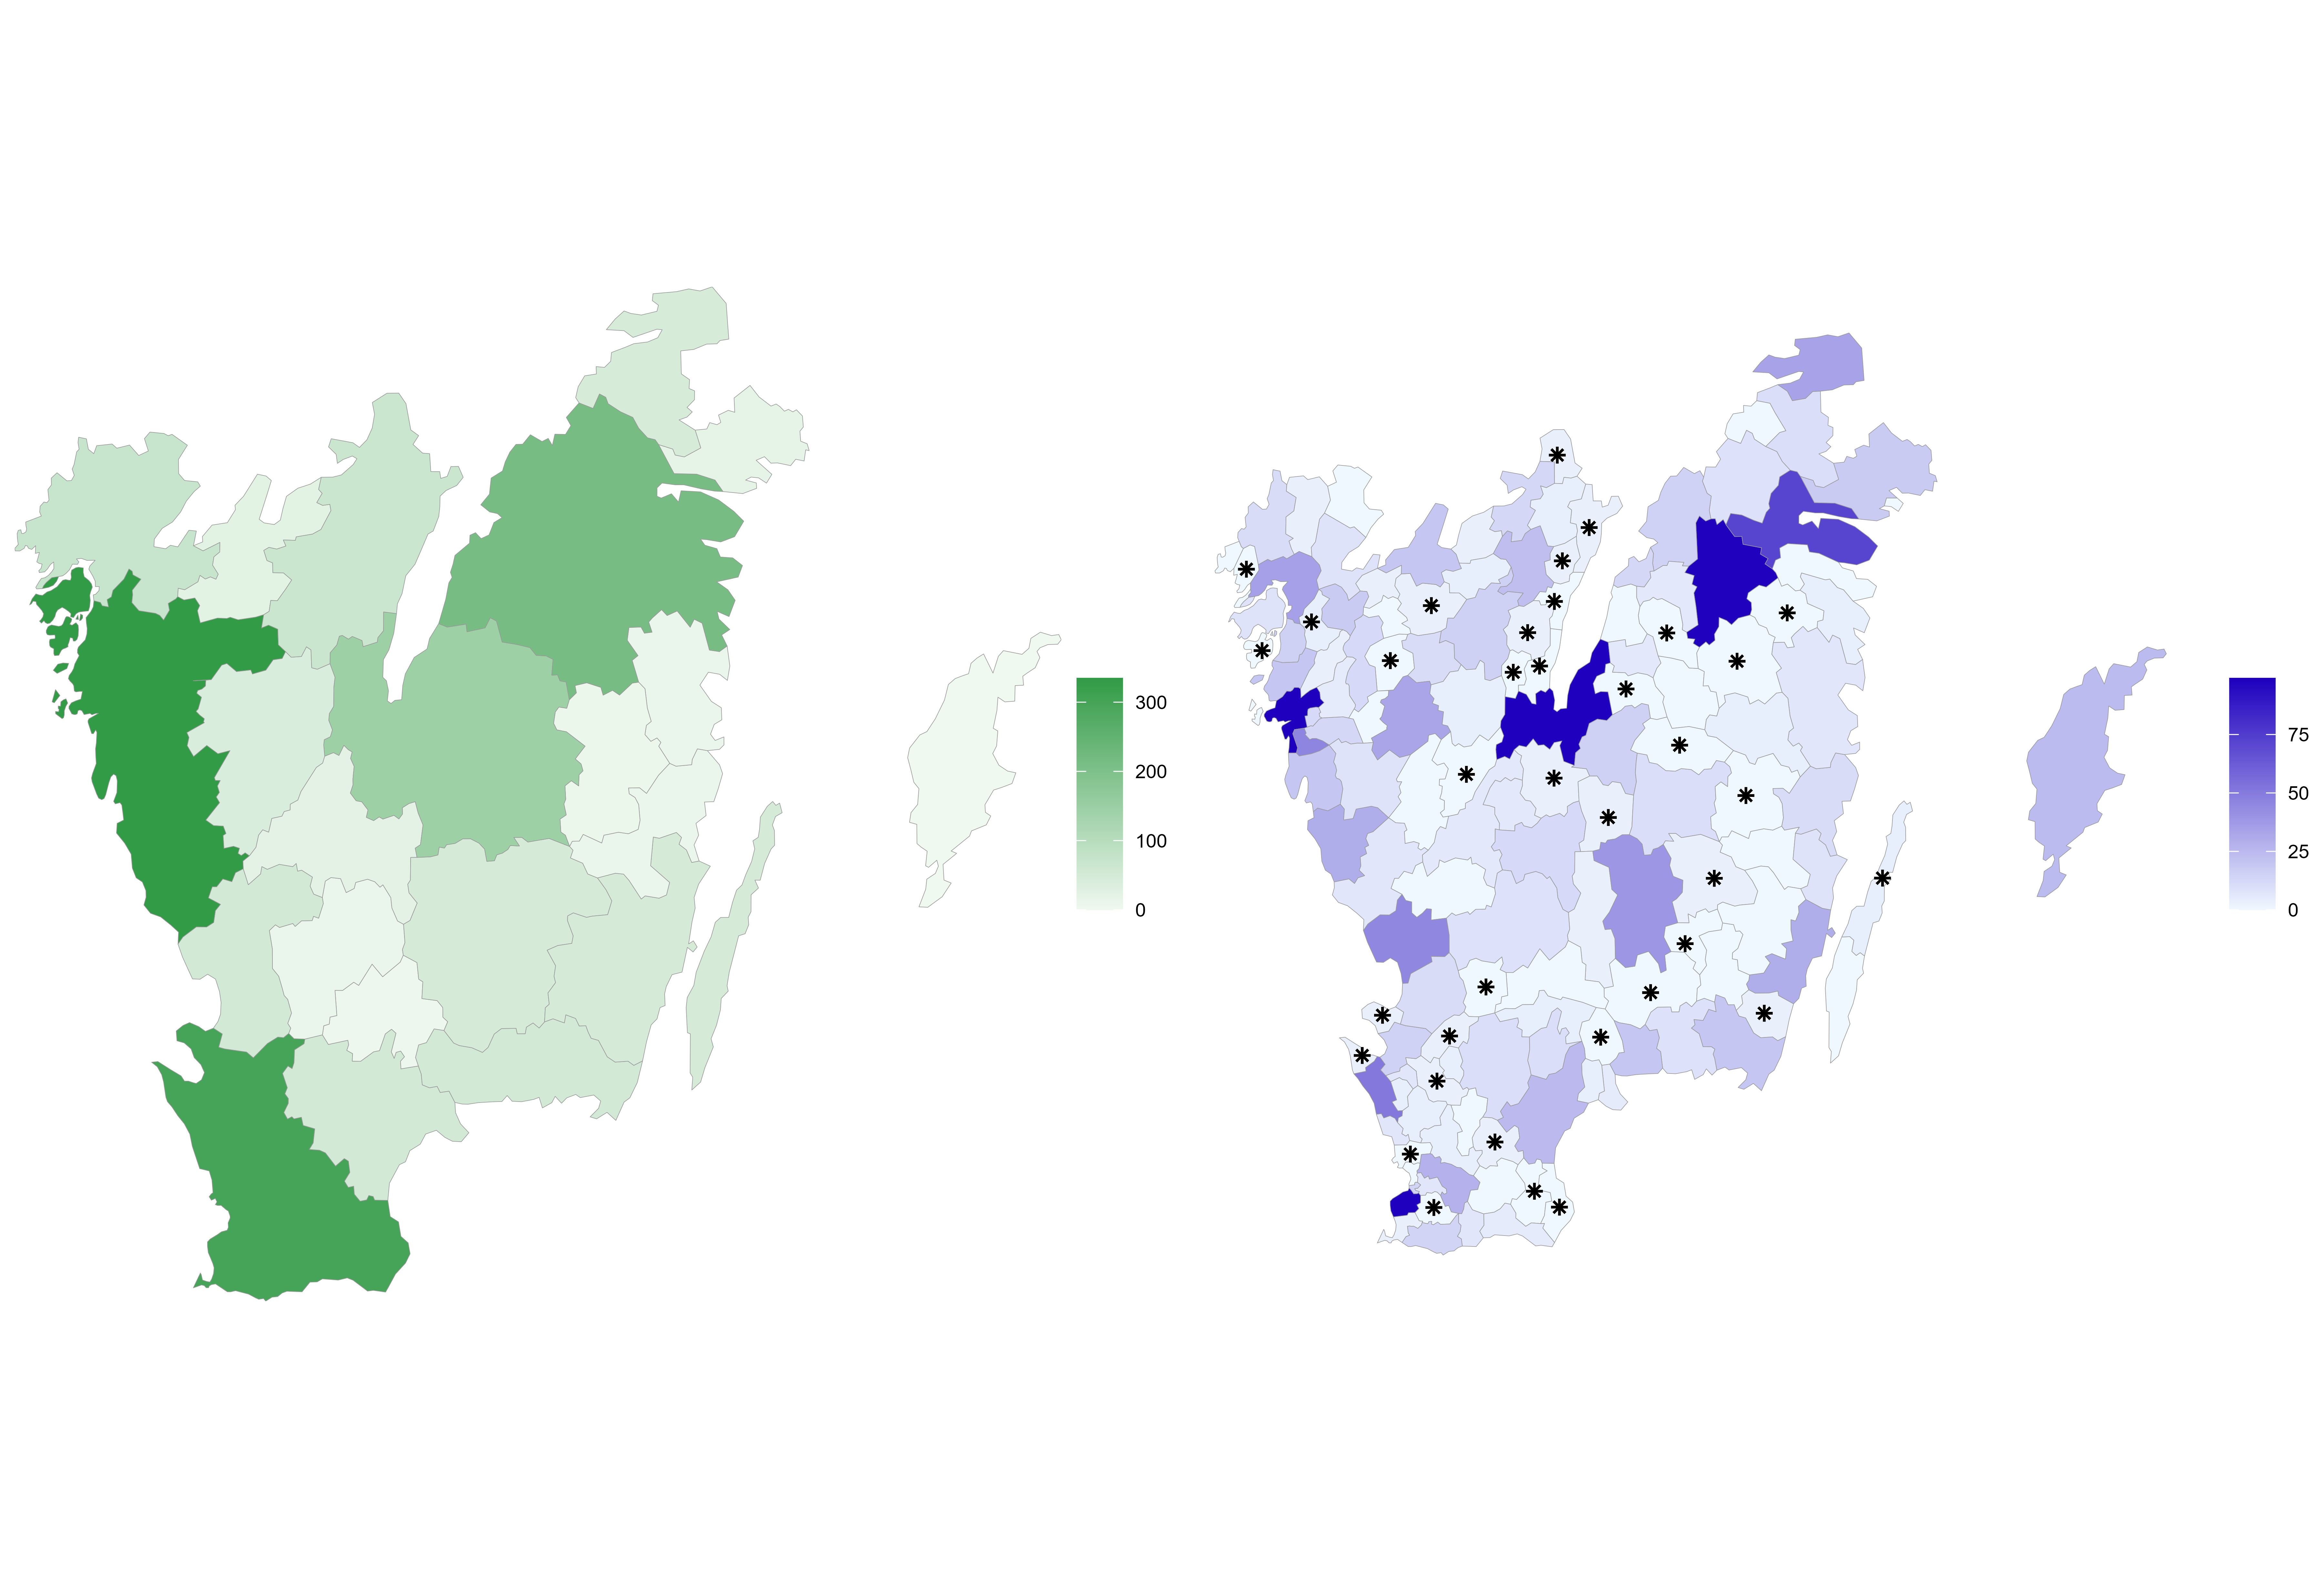
The maps below show the number of fully matched individuals in the skilled trades occupations of roofers, floor layers, insulation workers, and glaziers in southern Sweden. The most detailed level of reporting previously available was functional analysis regions (FA regions), but statistics can now be presented at the municipal level without the need to suppress values for confidentiality reasons, which previously meant that some municipalities were shown with values replaced by dots.
Number of fully matched employees within the occupational group Roofers, floor layers, insulation workers and glaziers, southern Sweden 2024
Definitions and explanations
The Regional Matching Indicators (RMI) were developed in 2013 by Reglab, a forum for learning about regional development, in collaboration with Statistics Sweden (SCB). Today, the indicators are managed and further developed by the Swedish Agency for Economic and Regional Growth (Tillväxtverket) together with SCB. The indicators consist of around twenty statistical tables aimed at reflecting both the supply and demand of educated labor and the degree of matching at the regional level.
The statistics are based on SCB’s registers: the Labor Market Status of the Population (BAS), the Register of Occupations (YREG), and the Register of Educational Attainment (UREG).
The assessment of which educations match which occupations is carried out within the framework of SCB’s Trends and Forecasts on Education and the Labour Market and is presented in a matching map available on the RMI product page.
Fully, partially, and not matched employees:
- Fully matched means that both the field and the level of education are fully aligned with the requirements of the occupation.
- Partially matched means either that the field of education is fully aligned but the level of education is "incorrect," or that the field of education is only partially aligned, regardless of the level of education.
- Not matched means that there is no apparent alignment at all between the field of education and the occupation, regardless of the level of education.
To calculate proportions, the number of fully, partially, and non‑matched employees is divided by the total number of employees within an occupation (excluding cases with missing data).
Changes for users retrieving information with the help of an API
In the fall of 2025, PxWebApi v1 was replaced by PxWebApi v2. PxWebApi v1 will remain up and running until, 31 December 2026, but will after that no longer be functional. For more information and instructions on conversion, please see PxWebApi v2.