National accounts, first quarter 2024
GDP increased in the first quarter 2024
Statistical news from Statistics Sweden 2024-05-30 8.00
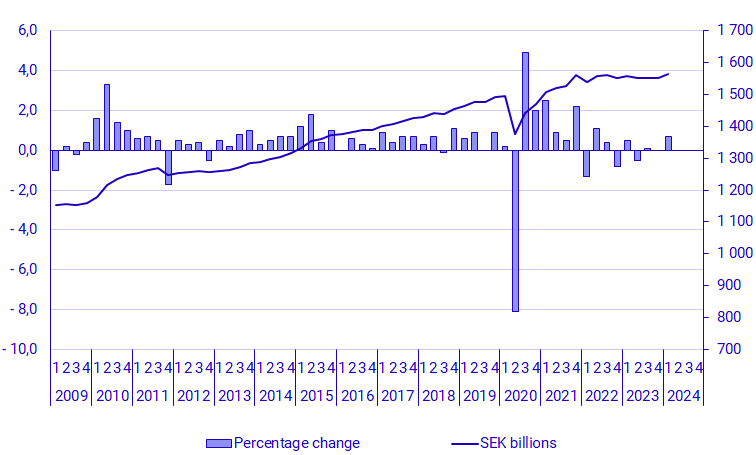
GDP increased by 0.7 percent in the first quarter 2024, seasonally adjusted and compared with the previous quarter. The largest contribution was from changes in inventories. Calendar adjusted and compared with the first quarter of 2023, GDP increased by 0.7 percent.
- GDP accelerated in the first quarter following a period of weaker growth. Several of the components to GDP increased modestly, but the largest contribution to the growth came from changes in inventories, says Jessica Engdahl, head of section at the National Accounts.
What is GDP?
Gross domestic product, GDP, is defined as the value of all goods and services produced in the country. GDP is used as a measure of economic growth and is published quarterly.
Summary of the first quarter
Percentages refer to seasonally adjusted volume changes compared with the previous quarter, unless otherwise stated. Tables available at the end of this statistical news also show volume changes in relation to the corresponding quarter the previous year.
- Household final consumption fell by 0.3 percent. Decreased expenditure in transports contributed the most.
- General government consumption increased by 0.2 percent. Local and regional governments rose by 0.1 percent while central government consumption increased by 0.5 percent.
- Changes in inventories contributed positively to GDP by 0.5 percentage points, mainly due to changes in trade inventories.
- Gross fixed capital formation rose by 0.6 percent. The increase was mainly due to investments in machinery and equipment and weapon systems while investments in dwellings continued to decrease.
- Exports rose by 0.2 percent while imports were essentially unchanged. Net exports contributed positively to GDP-growth by 0.1 percentage points.
- Value added in the business sector increased by 0.7 percent. Value added rose by 1.1 percent in the goods-producing industries and by 0.6 percent in the service-producing industries. Government value added increased by 0.2 percent.
- The total number of employed persons decreased by 0.1 percent. The number of hours worked decreased by 0.1 percent both in the whole economy and in the business sector. Labour productivity in the business sector increased by 0.9 percent.
- Household real disposable income decreased by 0.2 percent compared to the first quarter of 2023.
- Public administration showed a deficit of SEK 19.4 billion in the first quarter of 2024. This can be compared to a deficit of SEK 13.8 billion during the same quarter in 2023.
| Current prices, SEK millions | Seasonally and calendar adjusted values | Non-adjusted values | ||
|---|---|---|---|---|
| 2024 q1 | Volume change, cf. with previous quarter,% | Contribution to GDP volume change, cf. with previous quarter,% points | Volume change, cf. with corresponding quarter last year,% | |
| GDP at market prices | 1 546 437 | 0.7 | 0.7 | 0.2 |
| Imports | 765 153 | 0.0 | 0.0 | ‑1.4 |
| Goods (SPIN A01–F43) | 483 604 | ‑0.1 | 0.0 | ‑3.1 |
| Services (SPIN G45–T98) | 281 549 | 0.0 | 0.0 | 1.7 |
| Total domestic supply | 2 311 590 | 0.5 | ‑0.4 | |
| Household consumption expenditure | 674 466 | ‑0.3 | ‑0.1 | 0.5 |
| Households excluding NPISH | 656 446 | ‑0.3 | ‑0.1 | 0.4 |
| NPISH [1] | 18 020 | 0.8 | 0.0 | 3.1 |
| Public consumption expenditure | 404 035 | 0.2 | 0.1 | 0.6 |
| Central government | 104 755 | 0.5 | 0.0 | 2.6 |
| Municipalities [2] | 299 280 | 0.1 | 0.0 | ‑0.1 |
| Gross fixed capital formation | 360 369 | 0.6 | 0.1 | ‑1.2 |
| Inventories [3] | 17 982 | 0.5 | ||
| Exports | 854 738 | 0.2 | 0.1 | 0.9 |
| Goods (SPIN A01–F43) | 596 047 | ‑1.2 | ‑0.5 | ‑1.5 |
| Services (SPIN G45–T98) | 258 691 | 3.4 | 0.6 | 7.2 |
| Total domestic demand | 2 311 590 | 0.5 | ‑0.4 | |
(1) Non-profit institutions serving households (2) Including regional governments (3) Including changes in valuables
| Seasonally and calendar adjusted values | Calendar adjusted values | |
|---|---|---|
| Volume change, cf. with previous quarter,% | Volume change, cf. with corresponding quarter last year,% | |
| GDP at market prices | 0.7 | 0.7 |
| Goods producers (SNI A01-F43) | 1.1 | ‑0.6 |
| Manufacturing (SNI C10-C33) | 3.1 | ‑0.2 |
| Service producers (SNI G45-T98) | 0.6 | 1.3 |
| Market production [1] | 0.7 | 0.6 |
| Government production | 0.2 | 1.1 |
| Hours worked [2] | ‑0.1 | ‑0.4 |
(1) Excluding tariffs and net product taxes (2) In the whole economy
Revisions
Every fifth year, the national accounts undergo a benchmark revision of the time series. The revision implies introducing any new or improved methods and sources into the accounts. In conjunction with this publication, updated figures for the years and quarters 1993-2024q1 are released. Years and quarters prior to 1993 will be disseminated in May of 2025.
More information on the benchmark revision is available at National Accounts, quarterly and annual estimates (scb.se).
In addition, the results of the detailed annual calculations of the year 2022 are published. The annual compilations are based on more detailed and complete source statistics. As a result, GDP growth for the calendar year 2022 has been revised down by 1.2 percentage points.
The quarters of 2023 have been revised in non-adjusted and seasonally adjusted values compared to the previous publication. The revisions are mainly due to the new levels set in the annual accounts for 2022 and in the benchmark revision of the time series. In cases with revised source data for 2023 the calculations have been updated. GDP-growth for the quarters of 2023 in the current and the previous publications is shown in the tables below.
GDP-growth, non-adjusted and compared with the first quarter of 2023, percent, current and previous publication
| 2023 q1 | 2023 q2 | 2023 q3 | 2023 q4 | Calendar year 2023 | |
|---|---|---|---|---|---|
| 2024-05-30 | 2.1 | ‑1.0 | ‑1.2 | ‑0.6 | ‑0.2 |
| 2024-02-29 | 2.2 | ‑0.8 | ‑1.5 | ‑0.7 | ‑0.2 |
GDP-growth, seasonally adjusted and compared with the previous quarter, percent, current and previous publication
| 2023 q1 | 2023 q2 | 2023 q3 | 2023 q4 | |
|---|---|---|---|---|
| 2024-05-30 | 0.5 | ‑0.5 | 0.1 | 0.0 |
| 2024-02-29 | 0.7 | ‑0.7 | ‑0.1 | ‑0.1 |
Changes for users retrieving information with the help of an API
With the release of the first quarter of 2024, certain additions and changes have been made to a number of tables in the Statistical Database. Unfortunately, these improvements have implied that three of the tables have been substituted and that existing APIs against them therefore no longer function and will need to be replaced.
The tables in question are:
Labour costs (ESA2010) by industrial classifcation SNI 2007. Year 1980 - 2021. PxWeb (scb.se)
In addition, three new tables are published due to the implementation of the updated COICOP classification for household consumption expenditure by purpose:
Household consumption expenditure (ESA2010) by purpose COICOP. Quarter 2023K4. PxWeb (scb.se)
Household consumption expenditure (ESA2010) by purpose COICOP. Year 2021. PxWeb (scb.se)
Next publishing will be
The GDP indicator for the second quarter of 2024 will be published on 2024-07-29 at 8:00.
Complete quarterly national accounts for the second quarter of 2024 will be published on 2024-08-29 at 8:00.
Statistical Database
More information is available in the Statistical Database
Feel free to use the facts from this statistical news but remember to state Source: Statistics Sweden.