National accounts, first quarter 2025
GDP decreased in the first quarter 2025
Statistical news from Statistics Sweden 2025-05-30 8.00
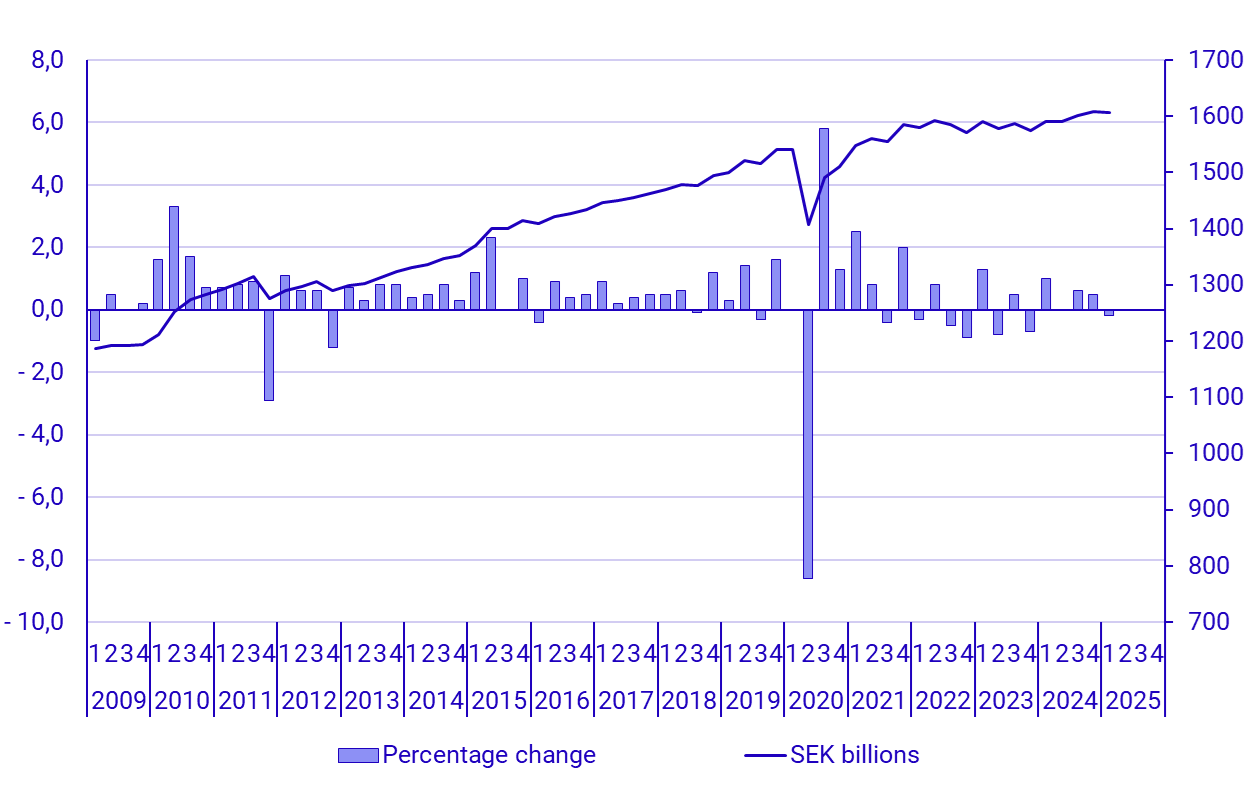
GDP decreased by 0.2 percent in the first quarter 2025, seasonally adjusted and compared with the previous quarter. The downturn was mainly notable in gross fixed capital formation while net exports rose significantly and contributed to holding GDP around the zero mark. Calendar adjusted and compared with the first quarter of 2024, GDP increased by 0.9 percent.
– GDP decreased somewhat in the first quarter and several components of GDP showed small changes. Gross fixed capital formation exhibited a marked decline, while exports of goods and services counteracted the negative pull on GDP, says Jessica Engdahl, head of section at the National Accounts.
What is GDP?
Gross domestic product, GDP, is defined as the value of all goods and services produced in the country. GDP is used as a measure of economic growth and is published quarterly.
Summary of the first quarter
Percentages refer to seasonally adjusted volume changes compared with the previous quarter, unless otherwise stated. Tables available at the end of this statistical news also show volume changes in relation to the corresponding quarter the previous year.
- Household final consumption decreased by 0.2 percent because of minor changes in most consumption purposes.
- General government consumption increased by 0.1 percent. Local and regional governments rose by 0.1 percent while central government consumption increased by 0.2 percent.
- Changes in inventories had a marginal impact on GDP-growth in the first quarter.
- Gross fixed capital formation decreased by 3.8 percent. The decrease was mainly due to investments in buildings and constructions.
- Exports rose by 1.8 percent and imports increased by 0.3 percent. Net exports contributed positively to GDP by 0.8 percentage points.
- Value added in the business sector decreased by 0.2 percent. In the goods-producing industries, value added fell by 2.8 percent and in the service-producing industries, value added increased by 1.1 percent. Government value added decreased by 0.5 percent.
- The total number of employed persons decreased by 0.1 percent. The number of hours worked decreased by 0.2 percent in the whole economy but increased by 0.1 percent in the business sector. Labour productivity in the business sector decreased by 0.3 percent.
- Household real disposable income decreased by 0.4 percent compared with the first quarter of 2024.
- Public administration showed a deficit of SEK 18.8 billion in the first quarter of 2025. This can be compared with a deficit of SEK 26.1 billion during the same quarter in 2024.
| Current prices, SEK millions | Seasonally and calendar adjusted values | Non-adjusted values | ||
|---|---|---|---|---|
| 2025 q1 | Volume change, cf. with previous quarter,% | Contribution to GDP volume change, cf. with previous quarter,% points | Volume change, cf. with corresponding quarter last year,% | |
| GDP at market prices | 1 552 810 | ‑0.2 | ‑0.2 | 0.4 |
| Imports | 816 776 | 0.3 | ‑0.2 | 1.9 |
| Goods (SPIN A01–F43) | 501 062 | 0.4 | ‑0.1 | 1.3 |
| Services (SPIN G45–T98) | 315 714 | 0.2 | 0.0 | 2.9 |
| Total domestic supply | 2 369 586 | 0.0 | 0.9 | |
| Household consumption expenditure | 702 454 | ‑0.2 | ‑0.1 | 0.2 |
| Households excluding NPISH | 683 474 | ‑0.2 | ‑0.1 | 0.2 |
| NPISH [1] | 18 980 | ‑0.3 | 0.0 | 0.1 |
| Public consumption expenditure | 412 743 | 0.1 | 0.0 | ‑0.2 |
| Central government | 111 967 | 0.2 | 0.0 | 0.8 |
| Municipalities [2] | 300 776 | 0.1 | 0.0 | ‑0.5 |
| Gross fixed capital formation | 351 908 | ‑3.8 | ‑1.0 | ‑3.7 |
| Inventories [3] | 28 672 | 0.0 | ||
| Exports | 873 809 | 1.8 | 1.0 | 5.2 |
| Goods (SPIN A01–F43) | 596 773 | 1.7 | 0.6 | 3.5 |
| Services (SPIN G45–T98) | 277 036 | 2.1 | 0.4 | 9.0 |
| Total domestic demand | 2 369 586 | 0.0 | 0.9 | |
(1) Non-profit institutions serving households (2) Including regional governments (3) Including changes in valuables
| Seasonally and calendar adjusted values | Calendar adjusted values | |
|---|---|---|
| Volume change, cf. with previous quarter,% | Volume change, cf. with corresponding quarter last year,% | |
| GDP at market prices | ‑0.2 | 0.9 |
| Goods producers (SNI A01-F43) | ‑2.8 | ‑2.2 |
| Manufacturing (SNI C10-C33) | ‑2.0 | ‑3.5 |
| Service producers (SNI G45-T98) | 1.1 | 2.9 |
| Market production [1] | ‑0.2 | 1.1 |
| Government production | ‑0.5 | 0.5 |
| Hours worked [2] | ‑0.2 | ‑0.6 |
(1) Excluding tariffs and net product taxes (2) In the whole economy
Revisions
The quarters of 2024 have been revised in non-adjusted and seasonally adjusted values compared to the previous publication. GDP-growth in the current and the previous publications is shown in the tables below.
| 2024 q1 | 2024 q2 | 2024 q3 | 2024 q4 | Calendar year 2024 | 2025 q1 | |
|---|---|---|---|---|---|---|
| 2025-05-30 | ‑0.5 | 1.1 | 1.5 | 1.9 | 1.0 | 0.4 |
| 2025-02-28 | ‑0.3 | 0.9 | 1.4 | 1.9 | 1.0 |
| 2024 q1 | 2024 q2 | 2024 q3 | 2024 q4 | 2025 q1 | |
|---|---|---|---|---|---|
| 2025-05-30 | 1.0 | 0.0 | 0.6 | 0.5 | ‑0.2 |
| 2025-02-28 | 0.7 | 0.2 | 0.6 | 0.8 |
Annual accounts and minor revision
In connection with this publication, the detailed annual calculation for 2023 is also published, and the quarters of 2023 have therefore been adjusted to the newly established annual levels. As a result of the detailed calculation, the development for the full year 2023 has been revised downwards by 0.1 percentage points in non-adjusted values.
The entire time series from 1980 has been revised due to a minor revision, and further information can be found under Minor revisions of time series in May 2025 (pdf).
Next publishing will be
The GDP indicator for the second quarter of 2025 will be published on 2025-07-29 at 8:00.
Complete quarterly national accounts for the second quarter of 2025 will be published on 2025-08-29 at 8:00.
Statistical Database
More information is available in the Statistical Database
Feel free to use the facts from this statistical news but remember to state Source: Statistics Sweden.