National accounts, second quarter 2019
GDP increased in the second quarter of 2019
Statistical news from Statistics Sweden 2019-09-13 9.30
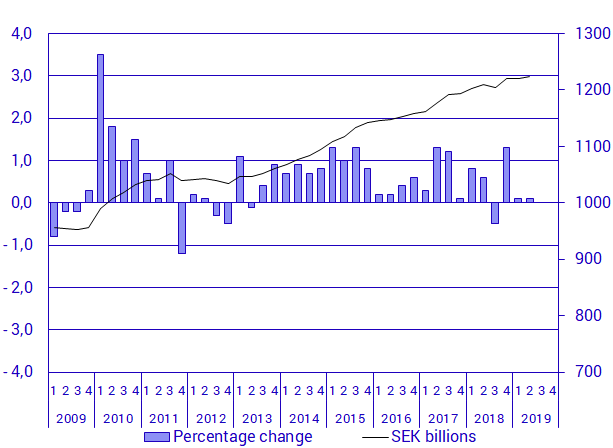
Sweden’s GDP increased 0.1 percent in the second quarter of 2019, seasonally adjusted and compared with the first quarter of 2019. This increase was mainly driven by household consumption. Calendar adjusted and compared with the second quarter of 2018, GDP grew by 1.0 percent.
What is GDP?
Gross domestic product, GDP, is defined as the value of all goods and services produced in the country. GDP is used as a measure of economic growth and is published quarterly.
Summary of the second quarter
Percentages refer to seasonally adjusted volume changes compared with the previous quarter, unless otherwise stated. Tables available at the end show volume changes in relation to the corresponding quarter in the previous year.
- Household final consumption increased by 1.1 percent. Household consumption abroad contributed most to the increase.
- General government consumption decreased by 0.1 percent. Central government consumption remained largely unchanged, while consumption in local government decreased by 0.1 percent.
- Changes in inventories contributed to GDP growth by 0.1 percentage points.
- Gross fixed capital formation decreased by 1.0 percent. This decline is mainly explained by reduced investments in housing.
- Exports remained largely unchanged, while imports increased by 0.3 percent. All in all, net exports reduced GDP growth by 0.1 percentage points.
- Market production increased by 0.2 percent. Output in goods-producing industries decreased by 0.1 percent, while service-producing industries increased by 0.3 percent. Government production increased marginally.
- The total number of persons employed decreased by 0.1 percent, while the number of hours worked increased by 0.2 percent. Labor productivity in the business sector decreased by 0.1 percent.
- Households’ real disposable income increased by 3.1 percent compared to the second quarter of 2018.
- The general government recorded a surplus of SEK 54.6 billion.

| Non- adjusted values | Seasonally and calendar adjusted values | Non-adjusted values | ||
|---|---|---|---|---|
| 2019 q2 | Current prices SEK million | Volume change, cf. with previous quarter,% | Contribution to GDP's volume change, cf. with previous quarter,% points | Volume change, cf. with corresponding quarter last year,% |
| GDP at market prices | 1 294 829 | 0.1 | 0.1 | 0.6 |
| Imports | 545 745 | 0.3 | ‑0.1 | 0.9 |
| Goods (SPIN A01–F43) | 370 186 | ‑0.6 | 0.2 | ‑2.1 |
| Services (SPIN G45–T98) | 175 559 | 2.2 | ‑0.3 | 8.1 |
| Total domestic supply | 1 840 574 | 0.2 | 0.7 | |
| Household consumption expenditure | 568 597 | 1.1 | 0.5 | 0.5 |
| Households excluding NPISH | 551 987 | 1.1 | 0.5 | 0.5 |
| NPISH [1] | 16 610 | 0.5 | 0.0 | 1.2 |
| General government consumption | 327 001 | ‑0.1 | 0.0 | ‑0.3 |
| Central government consumption | 83 585 | 0.0 | 0.0 | ‑0.6 |
| Local government consumption [2] | 243 416 | ‑0.1 | 0.0 | ‑0.1 |
| Gross fixed capital formation | 336 641 | ‑1.0 | ‑0.3 | ‑2.0 |
| Changes in inventories [3] | 7 402 | 0.1 | ||
| Exports | 600 933 | 0.0 | 0.0 | 4.0 |
| Goods (SPIN A01–F43) | 423 462 | 0.3 | 0.1 | 2.3 |
| Services (SPIN G45–T98) | 177 471 | ‑0.7 | ‑0.1 | 8.1 |
| Total domestic demand | 1 840 574 | 0.2 | 0.7 | |
(1) Non-profit institutions serving households (2) Including regional governments (3) Including changes in valuables
| Seasonally and calendar adjusted values | Calendar adjusted values | |
|---|---|---|
| Volume change, cf. with previous quarter,% | Volume change, cf. with corresponding quarter last year,% | |
| GDP at market prices | 0.1 | 1.0 |
| Goods producers (SNI A01-F43) | ‑0.1 | 1.8 |
| Manufacturing (SNI C10-C33) | -0.1 | 1.6 |
| Service producers (SNI G45-T98) | 0.3 | 1.3 |
| Market production [1] | 0.2 | 1.5 |
| Government production | 0.0 | 0.8 |
| Hours worked [2] | 0.2 | 1.2 |
(1) Excluding tariffs and net product taxes (1) In the whole economy
Revisions
1. Non-adjusted GDP growth has been revised compared with the publication of the second quarter 2019 in July.
- The first quarter 2019 has been revised downwards by 0.4 percentage points.
- The second quarter 2019 has been revised downwards by 0.3 percentage points.
2. As a result of a benchmark revision of the national accounts, all quarters since 1993 have been revised. Time series for periods preceding 1993 will be made available in connection with the publication of the third quarter of 2019.
Next publishing will be
Statistics concerning the third quarter of 2019 will be published on 2019-11-29 at 09:30.
The current quarterly tables from 1993 onwards are available on the Statistics Sweden website, under National Accounts, quarterly and annual reports, and in the statistical databases.
Statistical Database
More information is available in the Statistical Database
Feel free to use the facts from this statistical news but remember to state Source: Statistics Sweden.
