National accounts, second quarter 2024
GDP decreased in the second quarter 2024
Statistical news from Statistics Sweden 2024-08-29 8.00
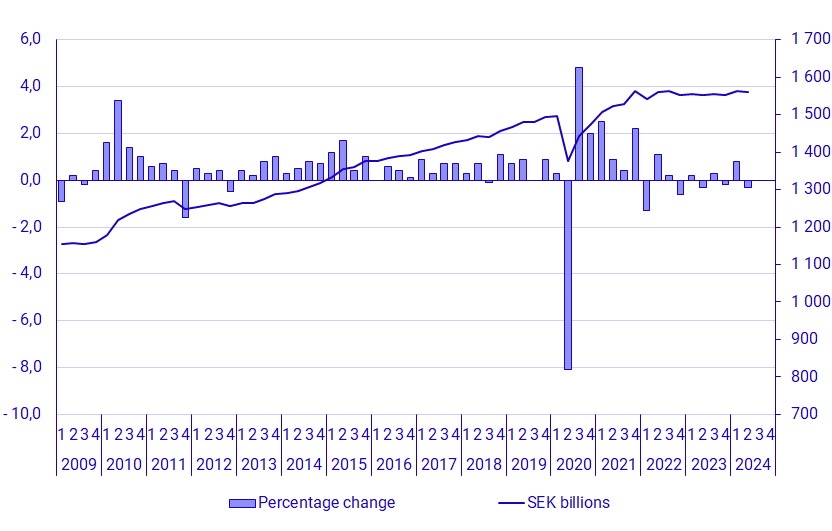
GDP decreased by 0.3 percent in the second quarter of 2024, seasonally adjusted and compared with the previous quarter. The downturn is mainly explained by changes in inventories. Calendar adjusted and compared with the second quarter of 2023, GDP increased by 0.5 percent.
– GDP decreased slightly in the second quarter. The downturn in the economy was wide but offset by the foreign trade in goods, where exports increased and imports decreased, says Jessica Engdahl, head of section at the National Accounts.
What is GDP?
Gross domestic product, GDP, is defined as the value of all goods and services produced in the country. GDP is used as a measure of economic growth and is published quarterly.
Summary of the second quarter
Percentages refer to seasonally adjusted volume changes compared with the previous quarter, unless otherwise stated. Tables available at the end of this statistical news also show volume changes in relation to the corresponding quarter the previous year.
- Household final consumption fell by 0.2 percent. Decreased expenditure on food and non-alcoholic beverages contributed most to the decline.
- General government consumption increased by 0.1 percent. Local and regional governments rose by 0.1 percent while central government consumption remained essentially unchanged.
- Changes in inventories contributed negatively to GDP by 0.6 percentage points.
- Gross fixed capital formation fell by 1.7 percent. The decrease was mainly due to investments in machinery and equipment and weapon systems whereas investments in intellectual property products increased for the second consecutive quarter.
- Exports rose by 1.0 percent while imports fell by 0.6 percent. Net exports contributed positively to GDP-growth by 0.9 percentage points.
- Value added in the business sector decreased by 0.4 percent. In the goods-producing industries, value added fell by 0.6 percent and in the service-producing industries by 0.4 percent. Government value added increased by 0.5 percent.
- The total number of employed persons decreased by 0.2 percent. The number of hours worked decreased by 0.5 percent in the whole economy and by 0.9 percent in the business sector. Labour productivity in the business sector increased by 0.4 percent.
- Household real disposable income increased by 2.0 percent compared to the second quarter of 2023.
- Public administration showed a surplus of SEK 22.1 billion in the second quarter of 2024. This can be compared to a surplus of SEK 30.3 billion during the same quarter in 2023.
| Current prices, SEK millions | Seasonally and calendar adjusted values | Non-adjusted values | ||
|---|---|---|---|---|
| 2024 q2 | Volume change, cf. with previous quarter,% | Contribution to GDP volume change, cf. with previous quarter,% points | Volume change, cf. with corresponding quarter last year,% | |
| GDP at market prices | 1 640 634 | ‑0.3 | ‑0.3 | 1.0 |
| Imports | 809 073 | ‑0.6 | 0.3 | ‑0.1 |
| Goods (SPIN A01–F43) | 507 093 | ‑1.1 | 0.4 | ‑2.6 |
| Services (SPIN G45–T98) | 301 980 | 0.4 | ‑0.1 | 4.6 |
| Total domestic supply | 2 449 707 | ‑0.4 | 0.7 | |
| Household consumption expenditure | 736 168 | ‑0.2 | ‑0.1 | 0.0 |
| Households excluding NPISH | 715 798 | ‑0.2 | ‑0.1 | ‑0.1 |
| NPISH [1] | 20 370 | 0.5 | 0.0 | 2.9 |
| Public consumption expenditure | 423 687 | 0.1 | 0.0 | 1.5 |
| Central government | 113 817 | 0.0 | 0.0 | 1.4 |
| Municipalities [2] | 309 870 | 0.1 | 0.0 | 1.6 |
| Gross fixed capital formation | 403 005 | ‑1.7 | ‑0.4 | ‑2.6 |
| Inventories [3] | ‑8 876 | ‑0.6 | ||
| Exports | 895 723 | 1.0 | 0.6 | 3.6 |
| Goods (SPIN A01–F43) | 609 268 | 1.4 | 0.5 | 2.2 |
| Services (SPIN G45–T98) | 286 455 | 0.2 | 0.0 | 6.8 |
| Total domestic demand | 2 449 707 | ‑0.4 | 0.7 | |
(1) Non-profit institutions serving households (2) Including regional governments (3) Including changes in valuables
| Seasonally and calendar adjusted values | Calendar adjusted values | |
|---|---|---|
| Volume change, cf. with previous quarter,% | Volume change, cf. with corresponding quarter last year,% | |
| GDP at market prices | ‑0.3 | 0.5 |
| Goods producers (SNI A01-F43) | ‑0.6 | ‑0.7 |
| Manufacturing (SNI C10-C33) | ‑0.9 | 0.6 |
| Service producers (SNI G45-T98) | ‑0.4 | 0.9 |
| Market production [1] | ‑0.4 | 0.3 |
| Government production | 0.5 | 2.3 |
| Hours worked [2] | ‑0.5 | 0.1 |
(1) Excluding tariffs and net product taxes (2) In the whole economy
Revisions
The quarters of 2023 and the first quarter of 2024 have been revised in non-adjusted and seasonally adjusted values compared to the previous publication. GDP-growth in the current and the previous publications is shown in the tables below.
GDP-growth, non-adjusted and compared with the first quarter of 2023, percent, current and previous publication
| 2023 q1 | 2023 q2 | 2023 q3 | 2023 q4 | Calendar year 2023 | 2024 q1 | |
|---|---|---|---|---|---|---|
| 2024-08-29 | 1.8 | ‑1.2 | ‑0.9 | ‑0.9 | ‑0.3 | 0.4 |
| 2024-05-30 | 2.1 | ‑1.0 | ‑1.2 | ‑0.6 | ‑0.2 | 0.2 |
GDP-growth, seasonally adjusted and compared with the previous quarter, percent, current and previous publication
| 2023 q1 | 2023 q2 | 2023 q3 | 2023 q4 | 2024 q1 | |
|---|---|---|---|---|---|
| 2024-08-29 | 0.2 | ‑0.3 | 0.3 | -0.2 | 0.8 |
| 2024-05-30 | 0.5 | ‑0.5 | 0.1 | 0.0 | 0.7 |
Next publishing will be
The GDP indicator for the third quarter of 2024 will be published on 2024-10-29 at 8:00.
Complete quarterly national accounts for the third quarter of 2024 will be published on 2024-11-29 at 8:00.
Statistical Database
More information is available in the Statistical Database
Feel free to use the facts from this statistical news but remember to state Source: Statistics Sweden.