National accounts, third quarter 2025
GDP increased in the third quarter 2025
Statistical news from Statistics Sweden 2025-11-28 8.00
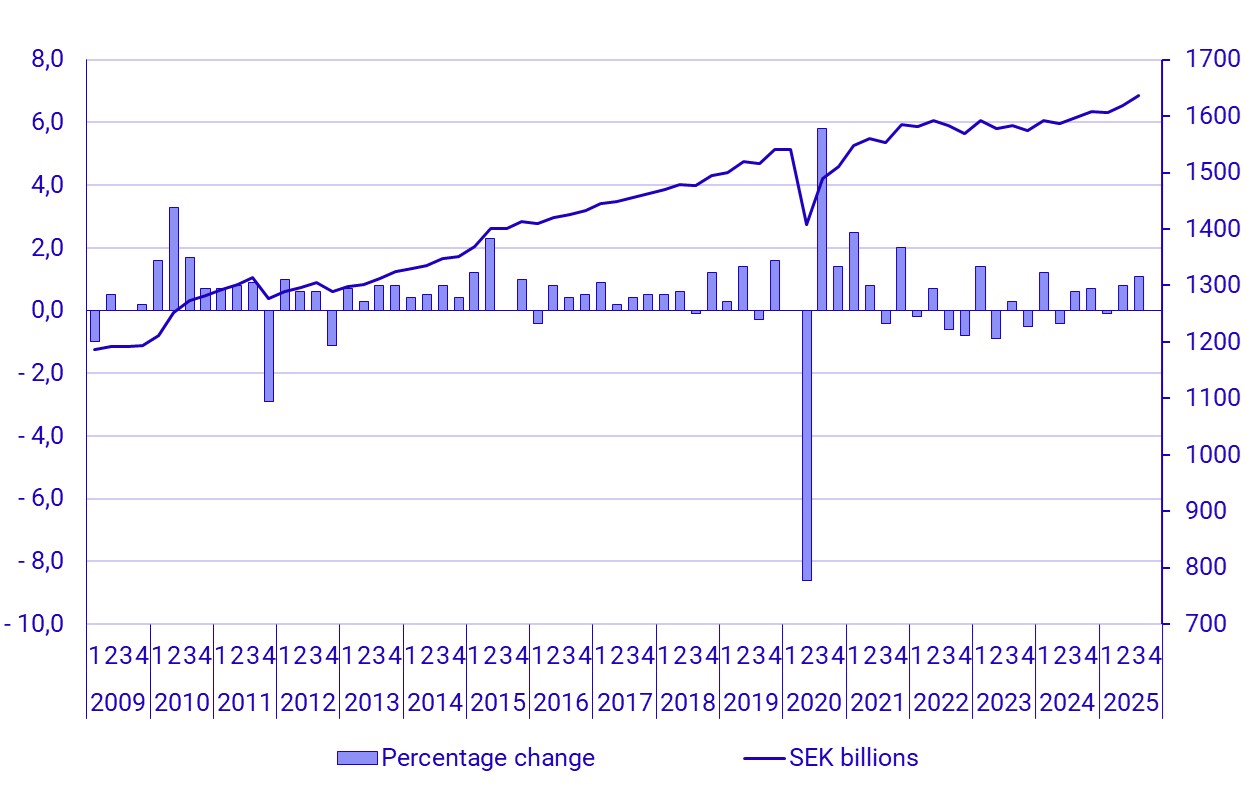
GDP increased by 1.1 percent in the third quarter 2025, seasonally adjusted and compared with the previous quarter. The upturn is explained by increases in exports, gross fixed capital formation and household consumption. Calendar adjusted and compared with the third quarter of 2024, GDP increased by 2.6 percent.
– GDP growth accelerated in the third quarter. The economic upturn was broad-based with contributions from exports, gross fixed capital formation and household consumption. High imports of services and lower build-up of inventories somewhat dampened growth, says Jessica Engdahl, head of section at the National Accounts.
What is GDP?
Gross domestic product, GDP, is defined as the value of all goods and services produced in the country. GDP is used as a measure of economic growth and is published quarterly.
Summary of the third quarter
Percentages refer to seasonally adjusted volume changes compared with the previous quarter, unless otherwise stated. Tables available at the end of this statistical news also show volume changes in relation to the corresponding quarter the previous year.
- Household final consumption increased by 0.8 percent. Expenditures on transport contributed the most, but expenditures on housing as well as on furnishings, clothing and shoes also increased.
- General government consumption increased by 0.3 percent. Local and regional governments rose by 0.2 percent and central government consumption increased by 0.8 percent.
- Changes in inventories contributed negatively to GDP growth by 0.5 percentage points, mainly due to changes in trade inventories.
- Gross fixed capital formation increased by 1.9 percent. The increase was mainly due to investments in total machinery and equipment and weapon systems as well as in buildings and constructions.
- Exports rose by 1.8 percent and imports increased by 0.8 percent. Net exports contributed positively to GDP growth by 0.6 percentage points.
- Value added in the business sector increased by 1.1 percent. In the goods-producing industries, value added increased by 1.4 percent, and in the service-producing industries, value added increased by 1.0 percent. Government value added increased by 1.0 percent.
- The total number of employed persons remained virtually unchanged. The number of hours worked increased by 0.4 percent in the whole economy and was essentially unchanged in the business sector. Labour productivity in the business sector rose by 1.1 percent.
- Household real disposable income increased by 2.2 percent compared with the third quarter of 2024.
- Public administration showed a deficit of SEK 6.4 billion in the third quarter of 2025. This can be compared with a deficit of SEK 29.3 billion during the same quarter in 2024.
| Current prices, SEK millions | Seasonally and calendar adjusted values | Non-adjusted values | ||
|---|---|---|---|---|
| 2025 q3 | Volume change, cf. with previous quarter,% | Contribution to GDP volume change, cf. with previous quarter,% points | Volume change, cf. with corresponding quarter last year,% | |
| GDP at market prices | 1 609 304 | 1.1 | 1.1 | 2.6 |
| Imports | 821 556 | 0.8 | ‑0.4 | 5.1 |
| Goods (SPIN A01–F43) | 469 795 | ‑0.7 | 0.2 | 2.0 |
| Services (SPIN G45–T98) | 351 761 | 3.0 | ‑0.6 | 9.7 |
| Total domestic supply | 2 430 860 | 1.0 | 3.5 | |
| Household consumption expenditure | 758 560 | 0.8 | 0.4 | 2.2 |
| Households excluding NPISH | 739 097 | 0.8 | 0.4 | 2.2 |
| NPISH [1] | 19 463 | 0.2 | 0.0 | 2.0 |
| Public consumption expenditure | 422 455 | 0.3 | 0.1 | 1.3 |
| Central government | 115 925 | 0.8 | 0.1 | 3.5 |
| Municipalities [2] | 306 530 | 0.2 | 0.0 | 0.5 |
| Gross fixed capital formation | 387 020 | 1.9 | 0.5 | 2.8 |
| Inventories [3] | 12 440 | ‑0.5 | ||
| Exports | 850 385 | 1.8 | 1.0 | 6.2 |
| Goods (SPIN A01–F43) | 546 752 | 1.5 | 0.6 | 6.8 |
| Services (SPIN G45–T98) | 303 633 | 2.3 | 0.4 | 5.0 |
| Total domestic demand | 2 430 860 | 1.0 | 3.5 | |
(1) Non-profit institutions serving households (2) Including regional governments (3) Including changes in valuables
| Seasonally and calendar adjusted values | Calendar adjusted values | |
|---|---|---|
| Volume change, cf. with previous quarter,% | Volume change, cf. with corresponding quarter last year,% | |
| GDP at market prices | 1.1 | 2.6 |
| Goods producers (SNI A01-F43) | 1.4 | 1.7 |
| Manufacturing (SNI C10-C33) | 2.1 | 4.6 |
| Service producers (SNI G45-T98) | 1.0 | 3.4 |
| Market production [1] | 1.1 | 2.8 |
| Government production | 1.0 | 1.7 |
| Hours worked [2] | 0.4 | 0.6 |
(1) Excluding tariffs and net product taxes (2) In the whole economy
Revisions
The quarters of 2024 as well as the first two quarters of 2025 have been revised in non-adjusted and seasonally adjusted values compared to the previous publication. GDP growth in the current and the previous publications is shown in the tables below.
| 2024 q1 | 2024 q2 | 2024 q3 | 2024 q4 | Calendar year 2024 | 2025 q1 | 2025 q2 | 2025 q3 | |
|---|---|---|---|---|---|---|---|---|
| 2025-11-28 | ‑0.6 | 0.9 | 1.6 | 1.9 | 0.9 | 0.1 | 1.3 | 2.6 |
| 2025-08-29 | ‑0.6 | 0.8 | 1.6 | 1.5 | 0.8 | 0.1 | 0.9 |
| 2024 q1 | 2024 q2 | 2024 q3 | 2024 q4 | 2025 q1 | 2025 q2 | 2025 q3 | |
|---|---|---|---|---|---|---|---|
| 2025-11-28 | 1.2 | ‑0.4 | 0.6 | 0.7 | ‑0.1 | 0.8 | 1.1 |
| 2025-08-29 | 0.9 | ‑0.3 | 0.8 | 0.4 | ‑0.2 | 0.5 |
Next publishing will be
The GDP indicator for the fourth quarter of 2025 will be published on 2026-01-29 at 8:00.
Complete quarterly national accounts for the fourth quarter of 2025 will be published on 2026-02-27 at 8:00.
Statistical Database
More information is available in the Statistical Database
Feel free to use the facts from this statistical news but remember to state Source: Statistics Sweden.