Demographic Analysis (DEMOG) Life expectancy by level of education
Increasing differences in life expectancy by educational level
Statistical news from Statistics Sweden 2025-06-02 8.00
Between 2014 and 2024, life expectancy increased for individuals across all education levels. However, in 2020, following the outbreak of covid-19, life expectancy fell substantially, especially among individuals with lower education. For those born in Sweden with primary education, the increase was weak over the whole period, and life expectancy was still lower in 2024 than in 2019.
There are clear differences in life expectancy between groups with different levels of education. People with secondary education have a few years longer life expectancy than those with only primary education, and those with post-secondary education, in turn, have a few years longer life expectancy than those with only secondary education. Over the past ten years, life expectancy has increased across all education groups, but the increase has been faster among those with higher education compared to those with lower education, leading to a widening gap between the groups.
Largest differences in life expectancy for individuals born in Sweden
During the period 2014 to 2024, the gap in life expectancy at age 30 between groups with shortest and longest education have increased by about a year among individuals born in Sweden. Among those with post-secondary education life expectancy has risen every year except for 2020, while for those with primary education it has fluctuated around the level of 2014. For the group with secondary education, life expectancy remained rather stable for the first years of the period, and then began to fluctuate with a rising trend. Among individuals born in Sweden, life expectancy of those with post-secondary education was 6.7 years higher than for those with primary education and 2.9 years higher than for those with secondary education in 2024. The gap between individuals with secondary and post-secondary education has also widened, increasing by approximately four months between 2014 and 2024.
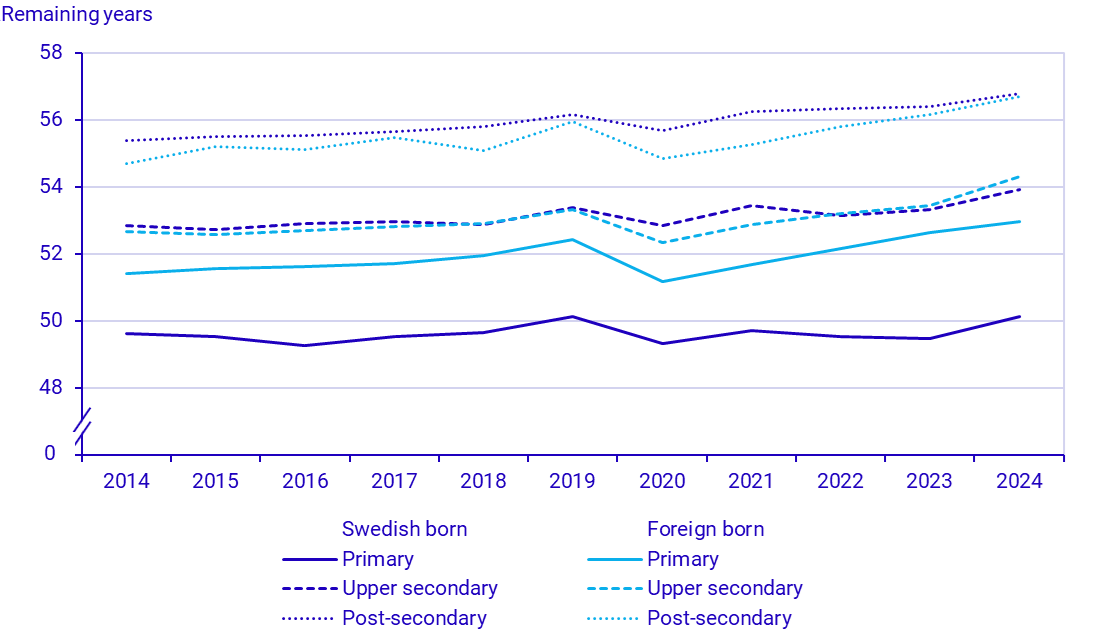
The differences between educational groups are smaller among foreign-born individuals than among those born in Sweden. In 2024, life expectancy for foreign-born individuals with post-secondary education was 3.7 years higher than for those with primary education and 2.4 years higher than for those with secondary education. During the years 2014—2024, life expectancy for foreign-born individuals with secondary and post-secondary education has remained close to that of their counterparts born in Sweden. However, among those with primary education, life expectancy has been noticeably higher for foreign-born individuals, and the gap has increased by a year between 2014 and 2024. Among foreign-born individuals, life expectancy in all education groups has increased by approximately six months per year since 2020.
Increased differences for single women
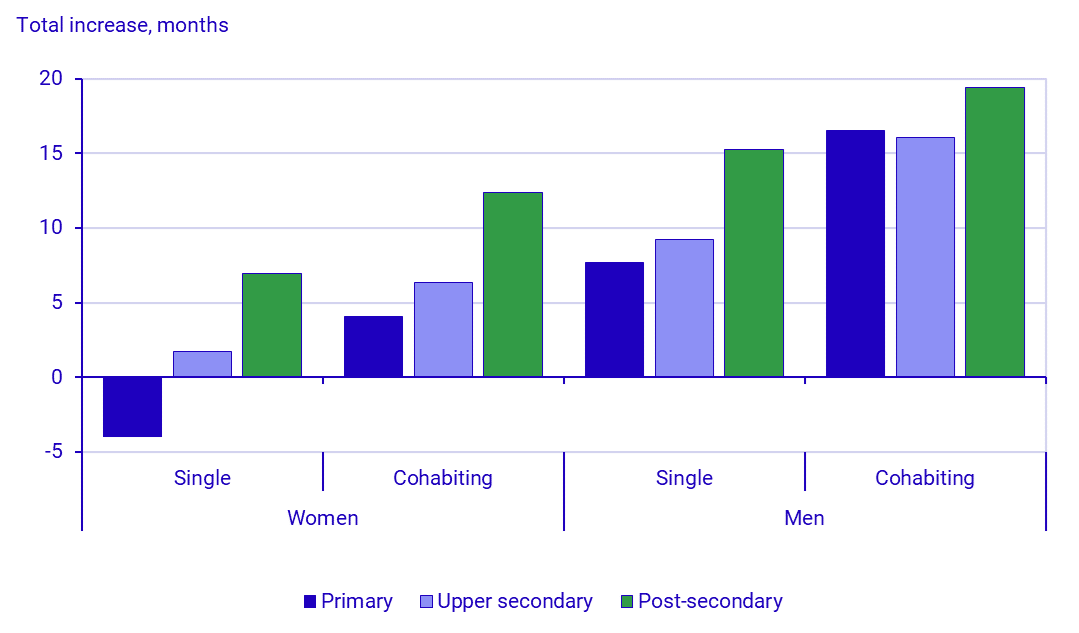
The time trends in life expectancy of different education groups over the past ten years vary depending on gender and household type, such as whether a person lives with a partner or not. Overall, life expectancy for individuals born in Sweden has increased most in the group with post-secondary education and least in the group with primary education, and this trend is stronger among women and non-cohabiting individuals.
For single women with primary education, life expectancy at age 65 has declined by four months over the past 10 years, and the gap compared to the group with post-secondary education has increased by eleven months. Among cohabiting women, life expectancy has increased across all education groups, but more for those with higher education. Therefore, the gap between those with primary and post-secondary education has increased, by eight months.
For men, the development of life expectancy has been more similar across the educational groups, particularly among men living with a partner. In this group, the difference in life expectancy between those with the highest and lowest education levels has increased by three months, which is less than in any other group. Among single men, the gap between those with the shortest and longest education levels has increased by seven months.
Clear differences in all counties
In each of the Swedish counties, there is an educational gradient in the number of remaining years at age 30. This gradient is stronger in some counties than others. During the period 2020—2024, the difference in remaining life expectancy at age 30 between individuals with post-secondary and primary education was smallest in Blekinge County (5.0 years) and largest in Gävleborg County (7.5 years). In the group with primary education, those living in Halland County have the highest number of remaining years (51.4), while those in Norrbotten County have the lowest (48.4). Among individuals with secondary education, the number of remaining years is also highest in Halland County (54.6) and lowest Norrbotten County (52.2). For the group with post-secondary education, the highest number of remaining years is found in Kronoberg and Jönköping Counties (both 56.8 years). In this group, residents of Västernorrland County have the lowest number of remaining years (55.3).
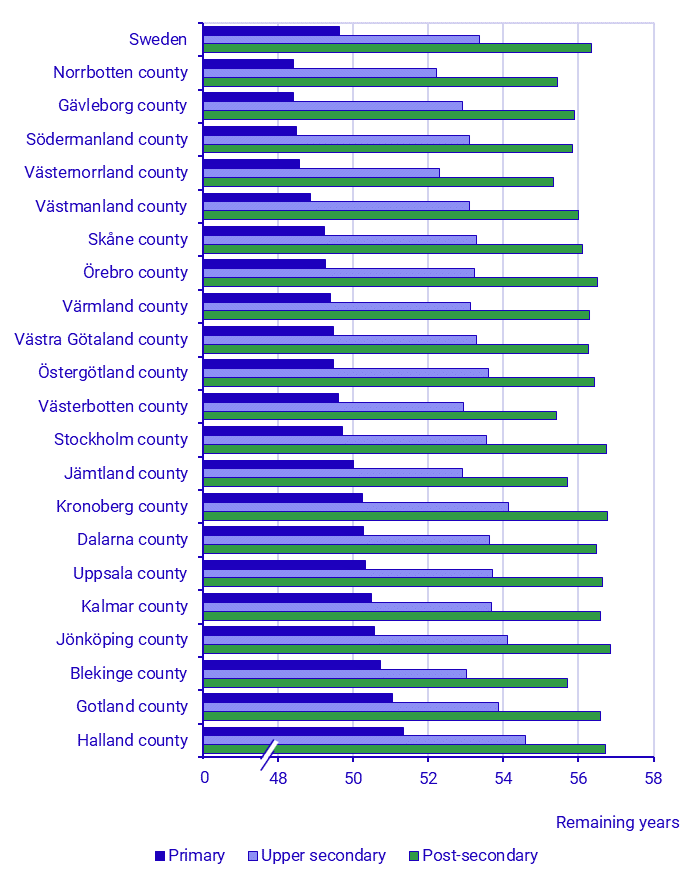
Counties are sorted by the number of remaining years for the group with compulsory education.
Definitions and explanations
Average remaining life expectancy is normally referred to as “life expectancy”. This is an index that describes mortality in all ages for a year or a specific period. Mortality is shown in a life table and the average number of years remaining is calculated for all ages. Here, the number of remaining years is reported from the age of 30 and 65 years.
The statistics refer to persons aged 30 years and older who were registered in the population various years between 2014 and 2024. In the statistical database there is more information and complete life tables.
These statistics have been produced based on data in Statistics Sweden’s Population Register, Household Register, and Education Register.
Publication
These statistics are published as complete life tables from 30 years in the Statistical Database on the website of Statistics Sweden in the following tables:
- Life tables by level of education, region of birth (Swedish born and foreign born), sex and age.
- Life tables by level of education, type of household, sex and age (limited to the population born in Sweden).
- Life tables by level of education, county, sex and age. Five-year periods (limited to the population born in Sweden).
These statistics are also published in tables and figures with comments on remaining life expectancy at 30 years and at 65 years.
Feel free to use the facts from this statistical news but remember to state Source: Statistics Sweden.