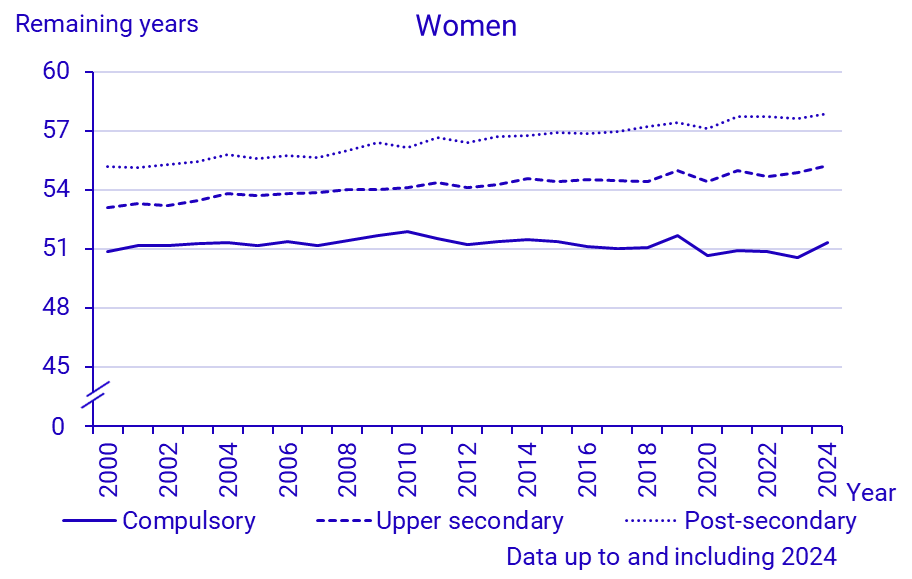
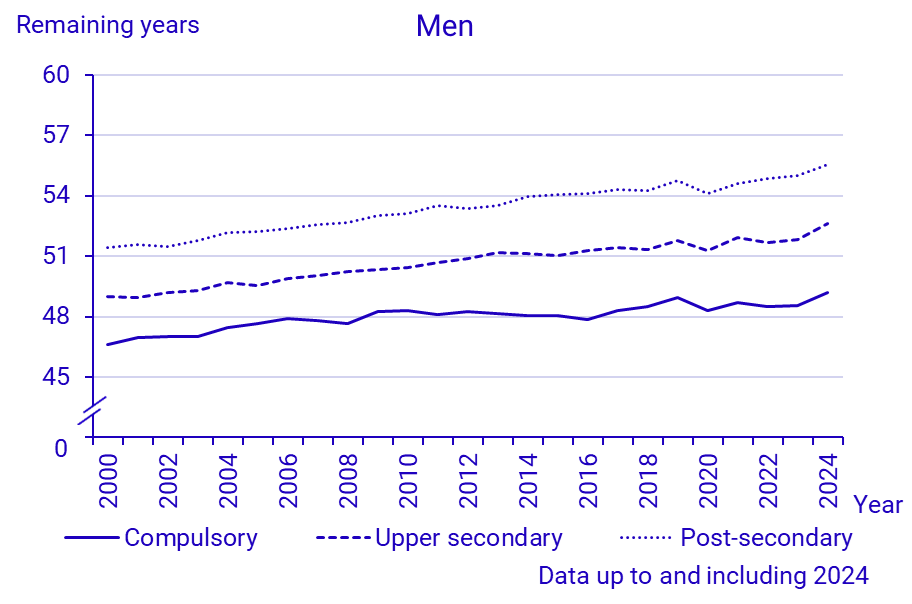
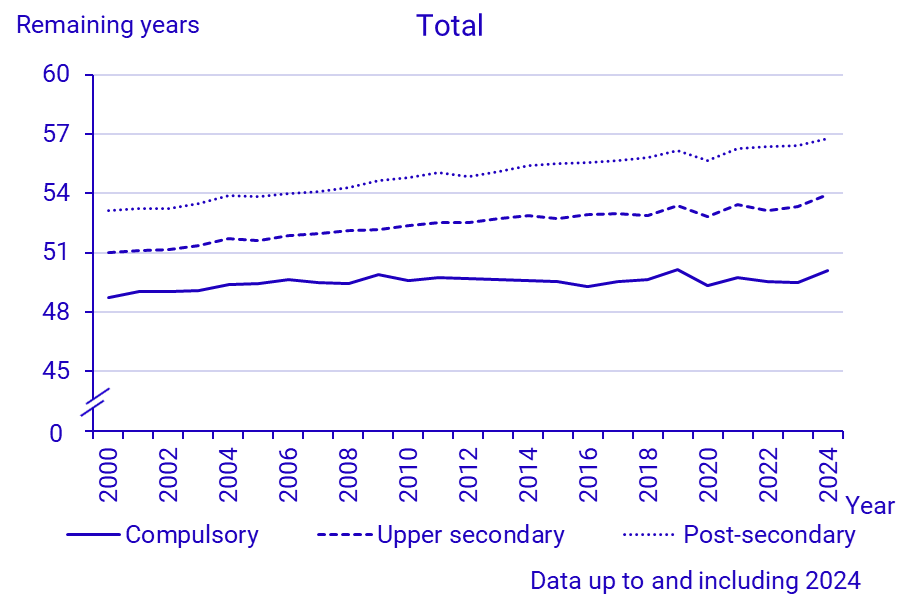
Life expectancy at age 30 by educational attainement 2000-2024


Comments
Throughout the period 2000–2024, the remaining life expectancy at age 30 has been highest for the group with post-secondary education and lowest for the group with primary education. Compared to year 2000, life expectancy has increased for both women and men, but the development has been uneven both over time and across education groups.
For women with primary education, the overall change since 2000 has been small. The group's life expectancy peaked in 2010, when it reached 51.9 years. Since then, the trend has been declining. During the covid-19 outbreak in 2020, life expectancy dropped by more than a year, which was more than in any other group. In 2024, life expectancy at age 30 for women with primary education was 51.3 years, which was lower than the year before the pandemic.
Among women with secondary education, life expectancy increased steadily until the early 2010s, but then slowed down and became more erratic, while women with post-secondary education experienced a more consistent increase throughout the period 2000–2024. In both groups, life expectancy was higher in 2021 than in 2019. In the years 2000-2024, the gap in life expectancy between women with primary and post-secondary education grew by 2.2 years, from 4.3 to 6.5 years.
Among men, life expectancy has increased significantly across all education levels. In 2024, life expectancy for men with primary education rose by 2.6 years compared to 2000, nearly matching the increase seen among women with post-secondary education over the same period. For men with secondary and post-secondary education, life expectancy grew by 3.6 and 4.1 years, respectively. The gap in life expectancy between those with primary and post-secondary education has widened less among men than among women, increasing from 4.8 years in 2000 to 6.3 years in 2024.
This report presents remaining life expectancy by education level for individuals born in Sweden. Results for foreign-born individuals can be found in the Statistical Database. Life expectancy calculations include adjustments for mortality risks at older ages: 90 years and older in 2000–2009, and 99 years and older in 2010–2011. The 2000–2011 adjustment ensures that all education groups are assigned the same mortality risk as native-born women and men nationwide from the respective older age thresholds. For individuals born before 1911, education data is unavailable, and certain adjustments have been made for mortality risks at the oldest ages in 2012 and earlier.